A farmer conducted an experiment to find out whether a new type of fertilizer would increase the size of tomatoes grown on his farm. The farmer randomly assigned 10 tomato plants to receive the new fertilizer and 10 tomato plants to receive the old fertilizer. All other growing conditions were the same for the 20 plants. At the end of the experiment, the mean weight of tomatoes grown with the new fertilizer was 0.4 ounce heavier than the mean weight of the tomatoes grown with the old fertilizer.
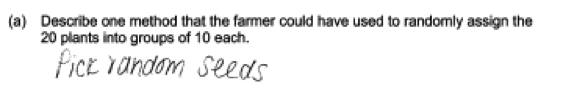
(a) Describe one method that the farmer could have used to randomly assign the 20 plants into groups of 10 each.
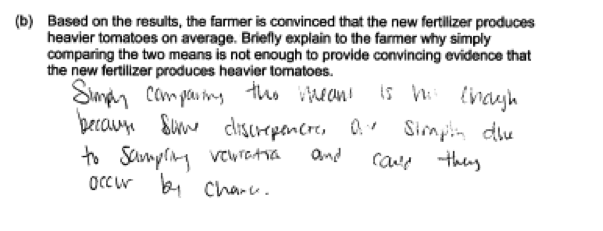
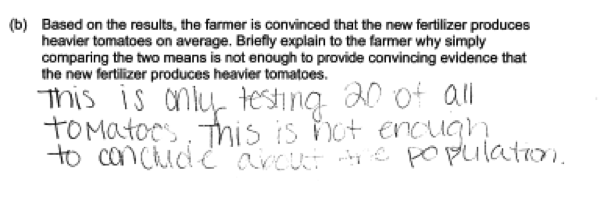
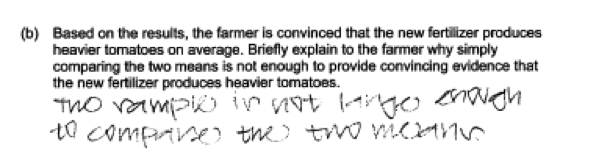
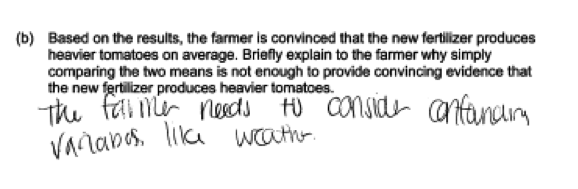
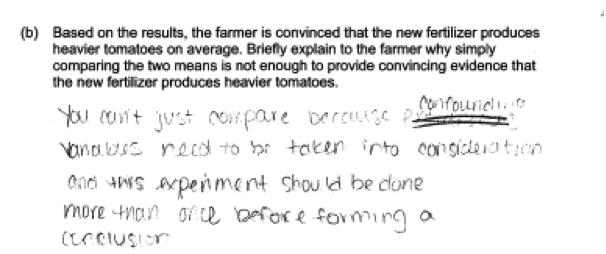
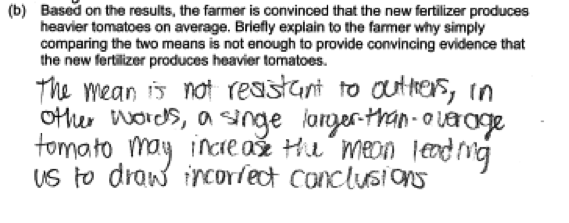
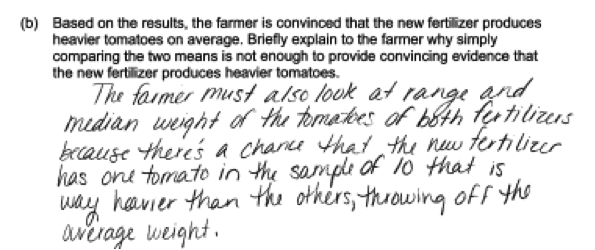
(b) Based on the results, the farmer is convinced that the new fertilizer produces heavier tomatoes on average. Briefly explain to the farmer why simply comparing the two means is not enough to provide convincing evidence that the new fertilizer produces heavier tomatoes.
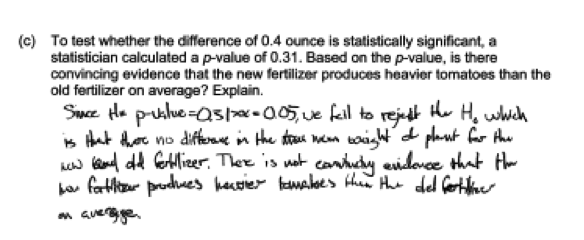
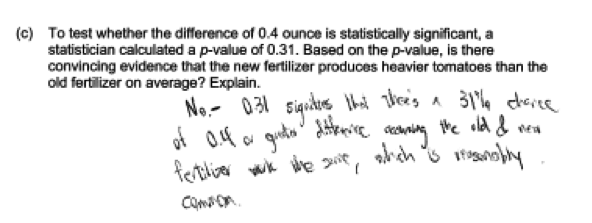
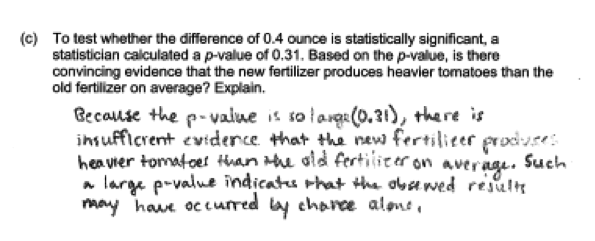
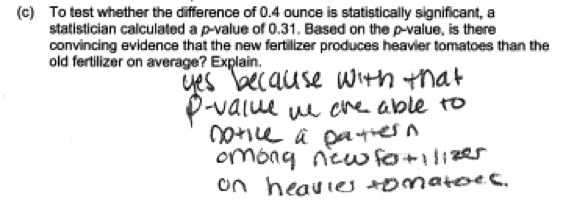
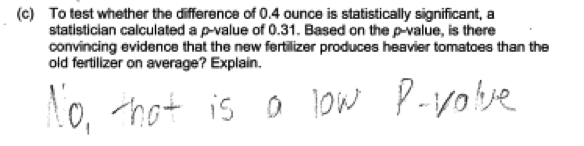
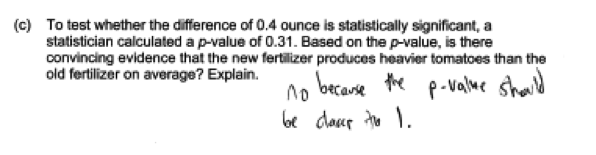
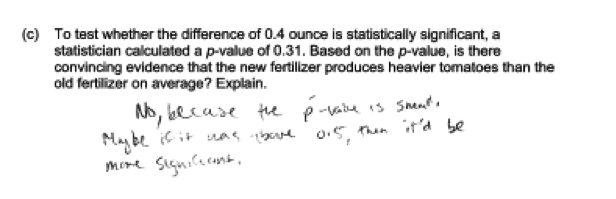
(c) To test whether the difference of 0.4 ounce is statistically significant, a statistician calculated a p-value of 0.31. Based on the p-value, is there convincing evidence that the new fertilizer produces heavier tomatoes than the old fertilizer on average? Explain.
Overview of the question
This question is designed to assess the student’s ability to:
1. Describe a process for randomly assigning experimental units to treatments in an experiment (part (a)).
2. Explain the need to take sampling variability into account when drawing conclusions based on data (part (b)).
3. Use a p-value to reach a conclusion about a difference in means (part (c)).
Ideal response and scoring
Part (a): Describe a process for randomly assigning experimental units to treatments in an experiment
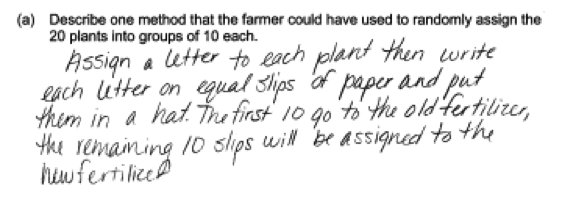
An ideal response to part (a) describes a way of assigning the 20 plants to the two fertilizers using some form of random assignment. To be considered essentially correct, the response needs to identify how the random assignment would be carried out and the method described would need to result in two groups with 10 plants in each group. Responses that are equivalent to pulling numbers from a box or hat need to specifically mention mixing in order to be considered essentially correct.
Because the question specified groups of equal size, responses that describe methods that use random assignment but that might result in groups of different sizes (for example, flipping a coin for each plant to determine which fertilizer the plant would receive) are considered to be partially correct for part (a). Responses that do not indicate a method of random assignment (for example just saying “randomly pick 10 plants for the first fertilizer”) but do describe a method that ensures that there are 10 plants in each fertilizer group are also considered partially correct for part (a).
Part (b): Explain the need to take sampling variability into account when drawing conclusions based on data
Part (b) asks students to explain why it is not appropriate to reach a decision based solely on the fact that one fertilizer group mean is greater than the other fertilizer group mean. An ideal response to part (b) recognizes that even if all plants received the same fertilizer, there would still be variability in tomato weights from one plant to another, and there is a need to determine if a difference of 0.4 ounce might be something that could be observed just by chance when there is no difference in the effect of the two fertilizers. To be considered essentially correct for part (b), the response must: (1) refer to sampling variability or the variability introduced by random assignment of plants to fertilizers, and (2) indicate that the observed difference in averages might be due to chance alone (the random assignment of plants to fertilizer groups).
Responses that only include one of these two required elements are considered to be partially correct for part (b). A response that does not include either of these two required elements (for example, one that just says “you need to do a test”), is considered to be incorrect for part (b).
Part (c): Use a p-value to reach a conclusion about a difference in means
Part (c) asks students to reach a conclusion based on a given p-value. An ideal response to part (c) is one that correctly interprets the given p-value of 0.31 as large and indicates that this means that there is not convincing evidence that the new fertilizer produces heavier tomatoes on average (that the observed difference of 0.4 ounce might be due to chance alone).
Responses that indicate that there is not convincing evidence of a difference in means but that do not clearly link this conclusion to the fact that the given p-value is large or that base the conclusion on an incorrect interpretation of the p-value are considered to be partially correct for part (c).
Responses that reach an incorrect conclusion, indicating that there is convincing evidence of a difference, are incorrect for part (c). Responses that state a conclusion with no supporting explanation or with an explanation that does not refer to the p-value (such as an explanation of “0.4 is small”) are also considered to be incorrect for part (c).
Sample responses indicating solid understanding
The following student response indicates a good understanding of the concepts assessed in the question and received a score of 4. In part (a), a correct method for random assignment of plants to fertilizers is described and the method ensures that there will be 10 plants in each group. The response in part (b) does a nice job of explaining why it is important to rule out chance as a possible explanation for the observed difference in averages before concluding that the new fertilizer is better. Part (c) reaches a correct conclusion and links the decision to the given p-value.
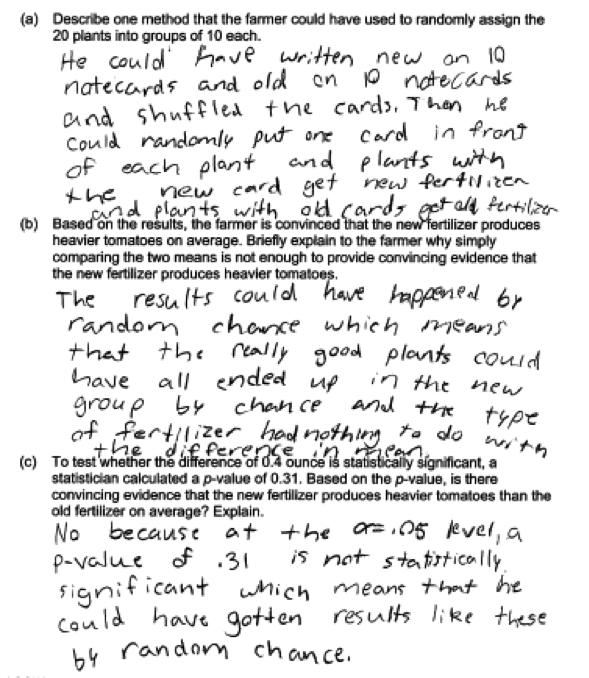
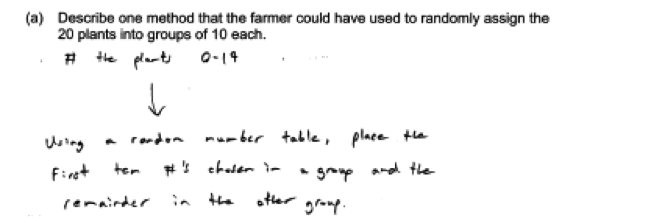
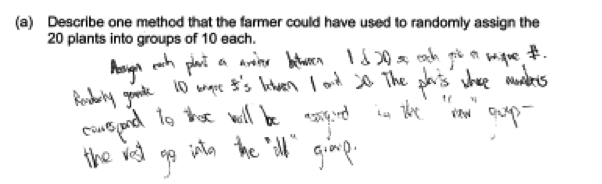
Part (a) asks students to describe a process for randomly assigning the plants to the two fertilizers. There are a number of correct ways that this could be done, and the two student responses that follow both received a score of essentially correct for part (a) because the method described results in random assignment of plants into two groups of 10.
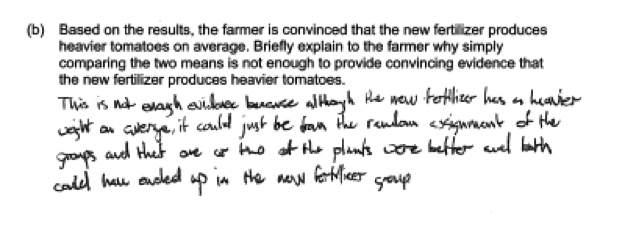
 In part (b), essentially correct responses could either appeal to the variability introduced by random assignment of plants to fertilizers or to the concept of sampling variability. These approaches are illustrated in the following two responses, which were both scored as essentially correct for part (b).
 In part (c), students that were familiar with hypothesis testing often compared the given p-value to a significance level (such as 0.05) and then indicted that they would not reject the hypothesis of no difference in the treatment means. However, it was not necessary to appeal to a formal hypothesis test procedure in order for part (c) to be scored as essentially correct. The first of the three student responses that follow illustrate the formal testing approach, but the other two responses were also scored as essentially correct for part (c) because they gave a correct conclusion and linked the conclusion to a correct interpretation of the given p-value.
Common misunderstandings
Part (a) Describe a process for randomly assigning experimental units to treatments in an experiment
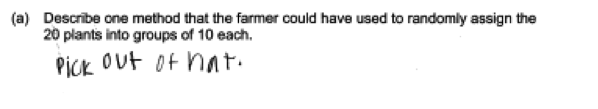
Responses that were not considered essentially correct on part (a) generally made one of four common errors. Some described a method that was equivalent to drawing numbers from a hat, but did not indicate that the slips of paper or the numbers in the hat would be mixed prior to drawing from the hat. The following two student responses illustrate this error.
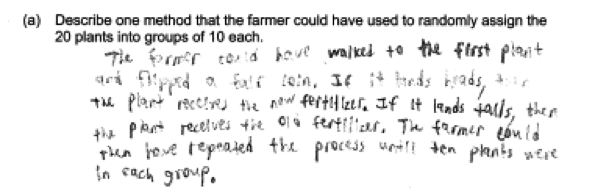
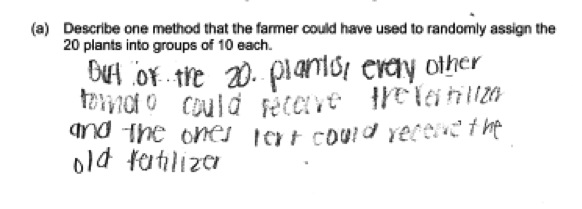
 A second error that resulted in a response being scored as only partially correct for part (a) was to describe a method that incorporated random assignment but that would not necessarily result in groups of equal size (which was a requirement stated in the question). For example, the method described in the following student response might result in groups of different sizes.
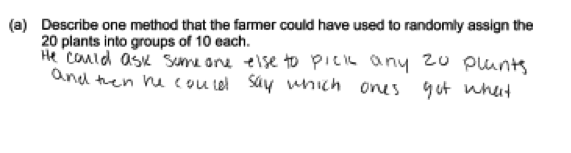
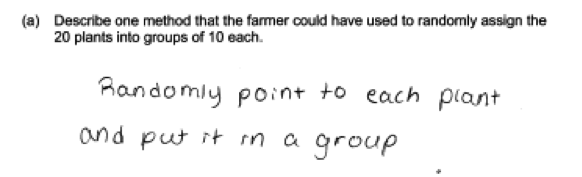
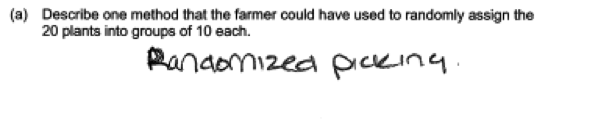
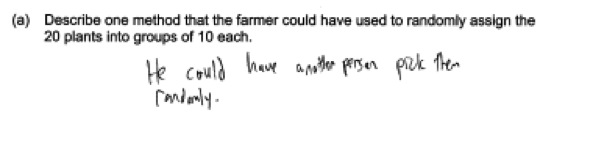
 There were also two common student errors that resulted in a score of incorrect for part (a). Both of these errors are related to the request that the student describe a method for random assignment of plants to fertilizers. Some students described methods that were not random, and others used the term random but did not actually describe a method for actually doing the random assignment. The following two student responses describe a method for assigning plants to fertilizers, but the method does not incorporate random assignment.
 The following four student responses illustrate the error of not actually describing a method for carrying out the random assignment.
Part (b) Explain the need to take sampling variability into account when drawing conclusions based on data
In part (b), by far the most common student error was to provide an explanation that was not related to chance variability and instead appeal to some other factor that was not relevant to the question posed (such as the sample size, the possibility of confounding variables, or the potential effect of an outlier). This is illustrated in the following six student responses.
Part (c) Use a p-value to reach a conclusion about a difference in means
Many students struggled with part (c). Some reached and incorrect conclusion while others based their conclusion on an incorrect use or interpretation of the given p-value. For example, in the student response below, an incorrect conclusion is given.
 In the following student response, the conclusion is based on an incorrect use of the p-value. Notice that the student compares the p-value to the observed difference in group means, which is not appropriate.
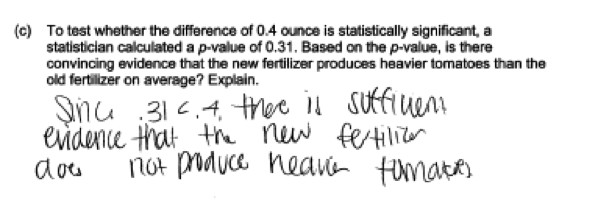 The following four student responses also illustrate incorrect interpretation of the given p-value and were all scored as incorrect for part (c).
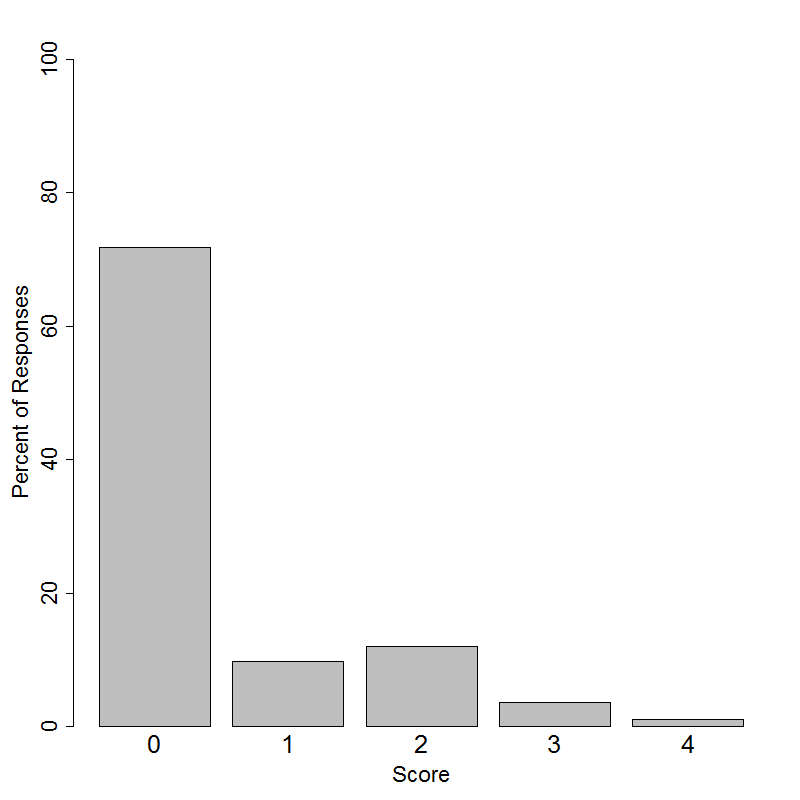
Student performance
Resources
More information about the content assessed in this question can be found in the following resources.
Free Resources
Webinars
The American Statistical Association has a number of webinars on its web site at
One webinar related to the topic of this question is the one titled “An Elementary Introduction to Experimental Design”.
Classroom and Assessment Tasks
Illustrative Mathematics has peer reviewed tasks that are indexed by Common Core Standard. A task that focuses on the need for random assignment is
Guidelines for Assessment and Instruction in Statistics Education (GAISE)
Published by the American statistical Association and freely available online, this document contains a discussion of the purpose of random assignment in an experiment on pages 54 – 55. There is also a nice discussion (Example 4: An Experiment on the Effects of Light on the Growth of Radish Seedlings, pages 75 -80 that addresses the content of this question.
Resources from the American Statistical Association
Making Sense of Statistical Studies is a collection of investigations suitable for classroom use. Section IV of this book is on drawing conclusions and the investigations in the section develop understanding of sampling variability and the need to take sampling variability into account when drawing conclusions from data.
Resources from the National Council of Teachers of Mathematics
The NCTM publication Developing Essential Understanding of Statistics in Grades 9 – 12 includes a discussion of the p-value as a “measure of surprise” on pages 52-54. It also includes a discussion of random assignment in an experiment on pages 61 – 64. For information see