A seventh grade class of twenty-seven students wants to estimate the proportion of eligible voters in their school district who intend to vote in the upcoming school board election. They decide to base their estimate on 270 eligible voters. Which of the following plans would allow the class to generalize from the sample to the population of all eligible voters?
(A) Have each of the 27 students randomly select 10 neighbors to participate in the survey.
(B) Mail surveys to all eligible voters and take the first 270 who respond.
(C) Mail surveys to 270 randomly selected eligible voters and follow-up with those who do not respond.
(D) Survey 270 people visiting a local grocery store on the Saturday before the election.
Standards
7.SP.1: Understand that statistics can be used to gain information about a population by examining a sample of the population; generalizations about a population from a sample are valid only if the sample is representative of that population. Understand that random sampling tends to produce representative samples and support valid inferences.
S-IC.3: Recognize the purposes of and di"erences among sample surveys, experiments, and observational studies; explain how randomization relates to each.
Correct answer and commentary
Student performance
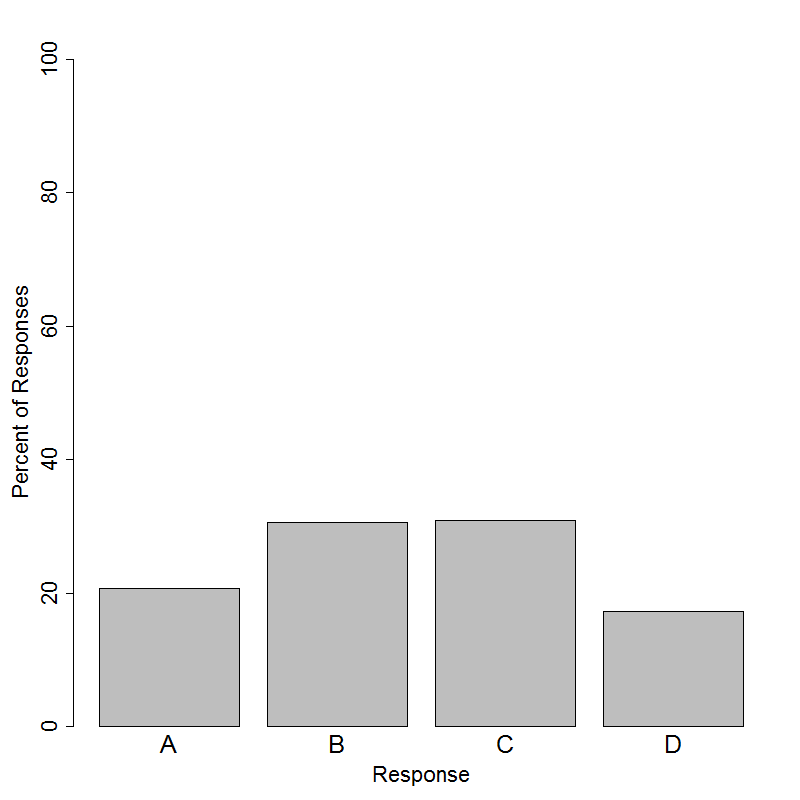
The correct answer to this item is Option (C). About 31% of students were able to answer this item correctly. The seventh grade class is interested in estimating the proportion of eligible voters in their school district who intend to vote in the upcoming election. They have chosen to collect a sample of 270 voters. In order to make generalizations about the population of interest using this sample, the people in the sample must be representative of the population. The best way to achieve this would be to randomly select people from the population of eligible voters in a way that allows each voter to have a chance of being selected. Option (C) is the only choice that details a plan where the people in the sample are randomly selected from the population of eligible voters. It is not reasonable to expect that every person selected will respond, so following-up with people is important to ensure a reasonable sample size.
The most popular distractor in this item was Option (B) with a response rate of about 31%. The main difference between this option and the correct answer is that there is no random element to how the people in the sample are selected. This sampling technique takes the first 270 respondents which leaves the sample open to multiple forms of bias. For example, the first 270 people to respond might be all of the people that strongly oppose a certain member of the school board, so they quickly send their survey responses. The sample would not necessarily represent the entire population of eligible voters, and the sampling method would not give everyone an equal chance of being a part of the sample results.
Option (A) was chosen by about 27% of students. This survey design again does not allow each person in the population of interest an equal chance of being sampled. There may be eligible voters that do not live close to any of the 27 students. Option (D) has this same flaw. There may be members of the eligible voter pool that do not show up to the local grocery store on that particular Saturday for some particular reason (e.g. people who work on Saturday), meaning all members of the population of interest do not have an equal chance of being selected.