Question:
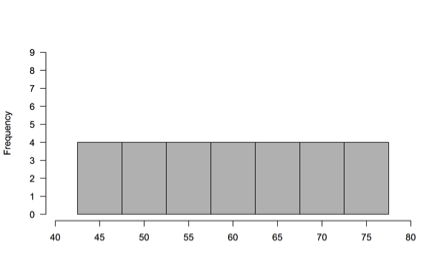
Three data sets are summarized in the histograms below.
Data Set A
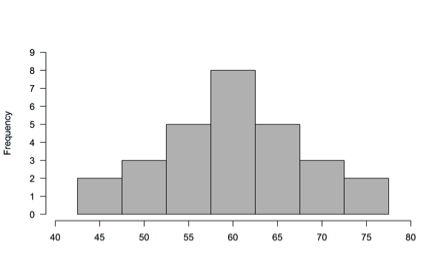
 Data Set B
 Data Set C
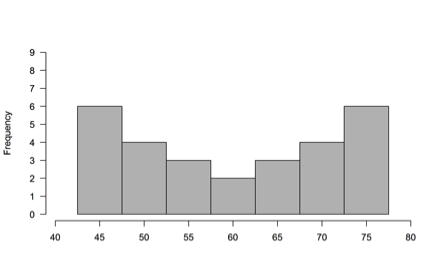
Which set of data varies the most from its mean?
(A) Data set A
(B) Data set B
(C) Data set C
(D) The variability from the mean is the same for all three data sets.
Level:
Intermediate
Standards
S-ID.4: Use the mean and standard deviation of a data set to fit it to a normal distribution and to estimate population percentages. Recognize that there are data sets for which such a procedure is not appropriate. Use calculators, spreadsheets, and tables to estimate areas under the normal curve.
Correct answer and commentary
Student performance
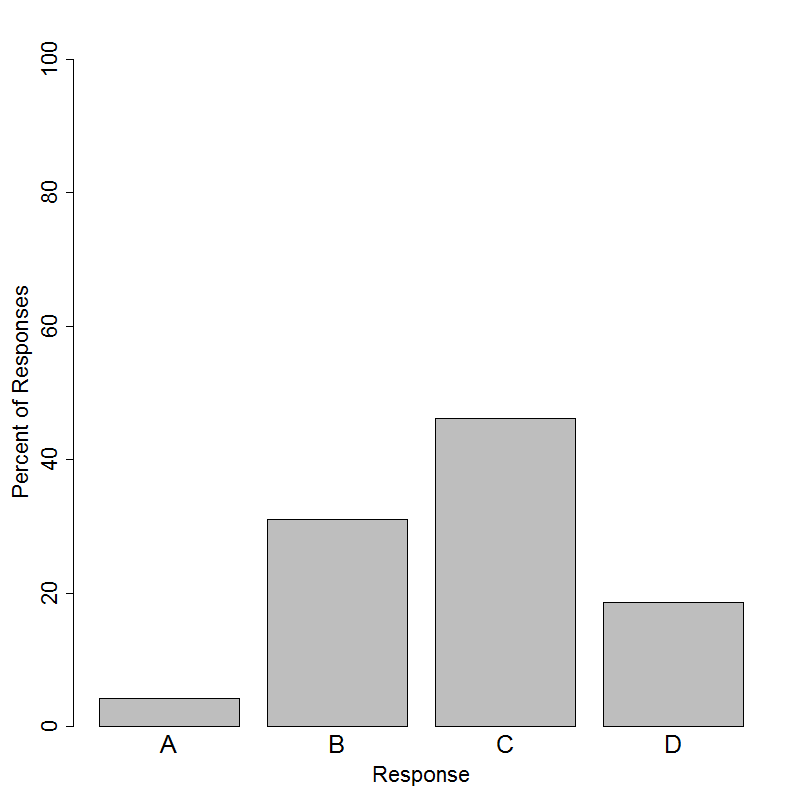
The correct answer to this question is Option (C). There is considerable evidence that students have difficulty interpreting histograms and often treat them as if they had some of the properties of bar graphs. In particular, students often incorrectly believe that variability in histograms is represented by variability in the heights of the bars.
Certain histograms with “extreme” features may be useful for illustrating how variability is represented; e.g., a dataset with no variability (all observations are equal) would be displayed as a single tall bar in a histogram. A dataset with a tremendous amount of variability would consist of two bars in a histogram separated quite far from each other; the mean would be between them, with no observations nearby. Adding observations between the two extreme bars would serve to decrease variability because these new observations would be closer to the mean. Histograms (B) and (C) are less-extreme versions of the aforementioned histograms.
The true order of the histograms - from varies most to varies least - is (C), (A), (B). Data from this question and other similar questions suggest that students incorrectly believe that (A) is the least variable because all of the bars are the same height.