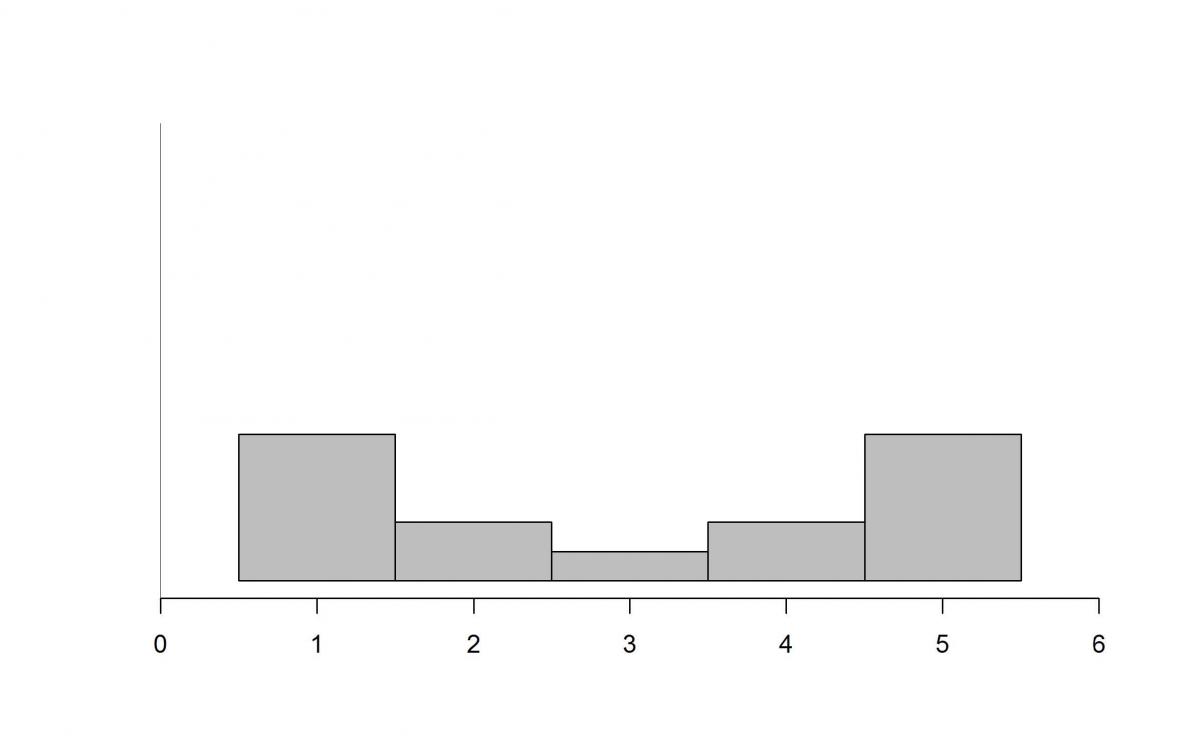
The histograms below show the distributions of test scores in four different classes, all graphed on the same scale. If each class has the same number of students, which of the distributions has the largest Mean Absolute Deviation (MAD)?
(A)
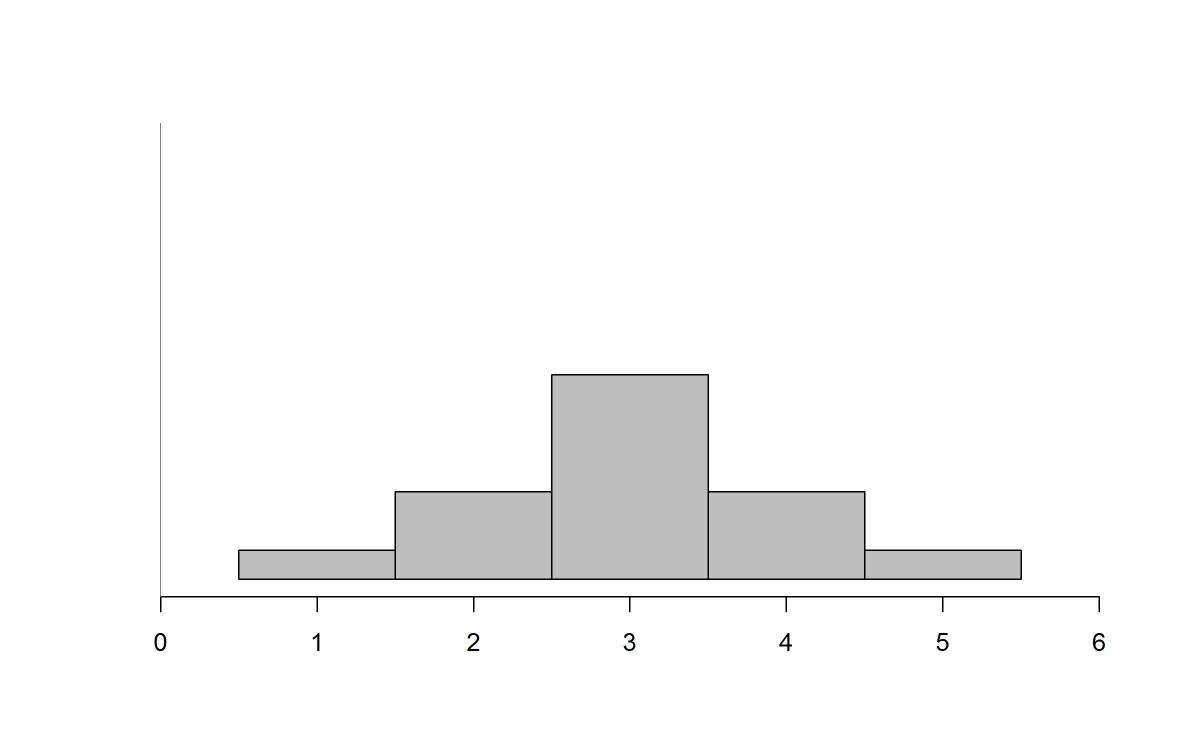
 (B)
(B)
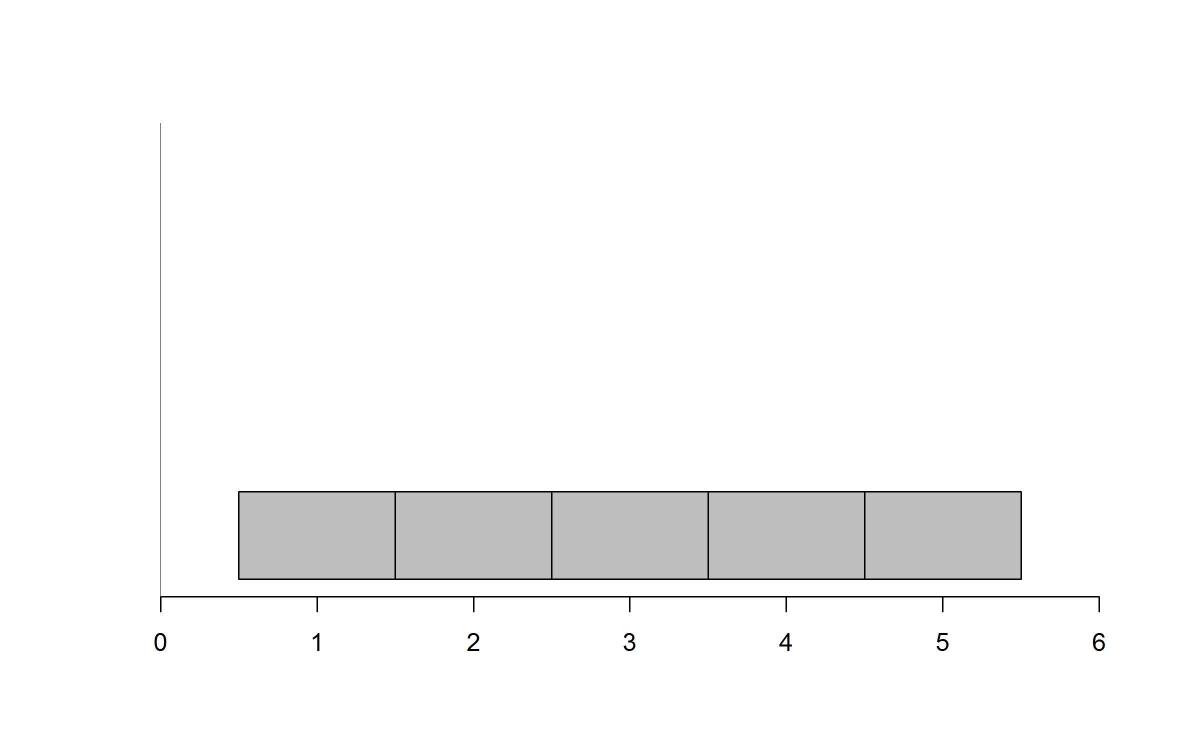
 (C)
(C)
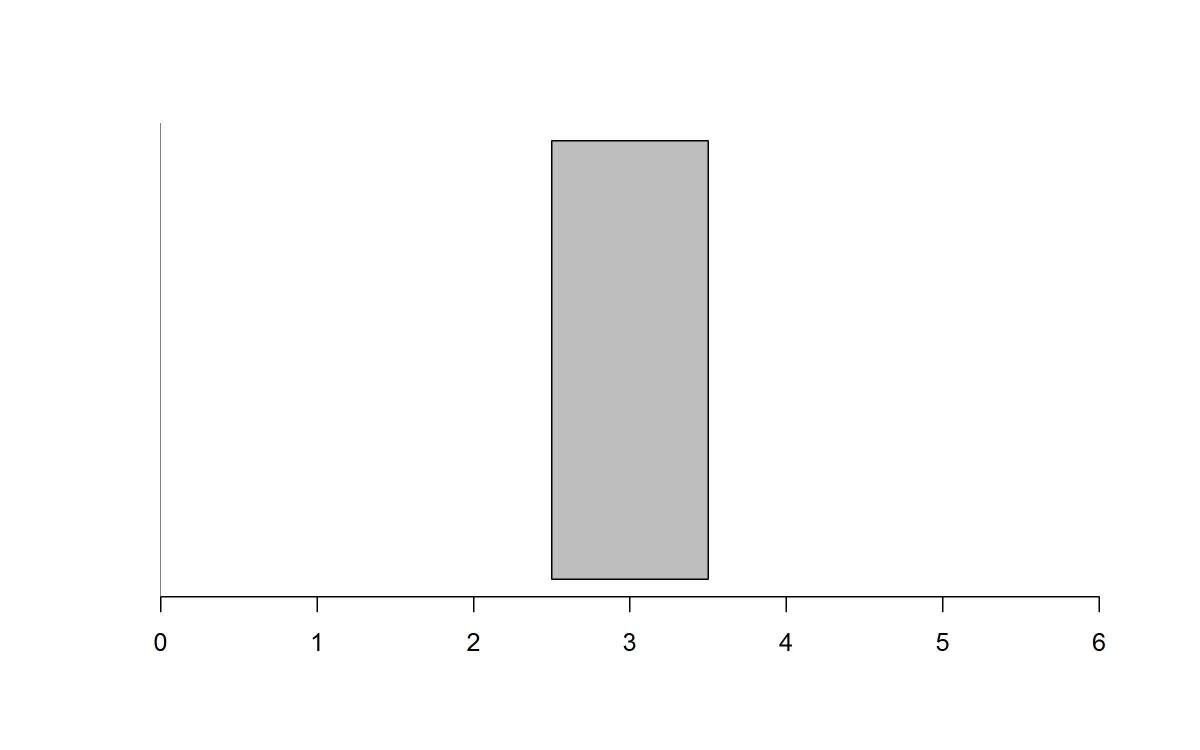
 (D)
(D)
Standards
6.SP.5c: Summarize numerical data sets in relation to their context, such as by: Giving quantitative measures of center (median and/or mean) and variability (interquartile range and/or mean absolute deviation), as well as describing any overall pattern and any striking deviations from the overall pattern with reference to the context in which the data were gathered.
S-ID.2: Use statistics appropriate to the shape of the data distribution to compare center (median, mean) and spread (interquartile range, standard deviation) of two or more di"erent data sets.
Correct answer and commentary
Student performance
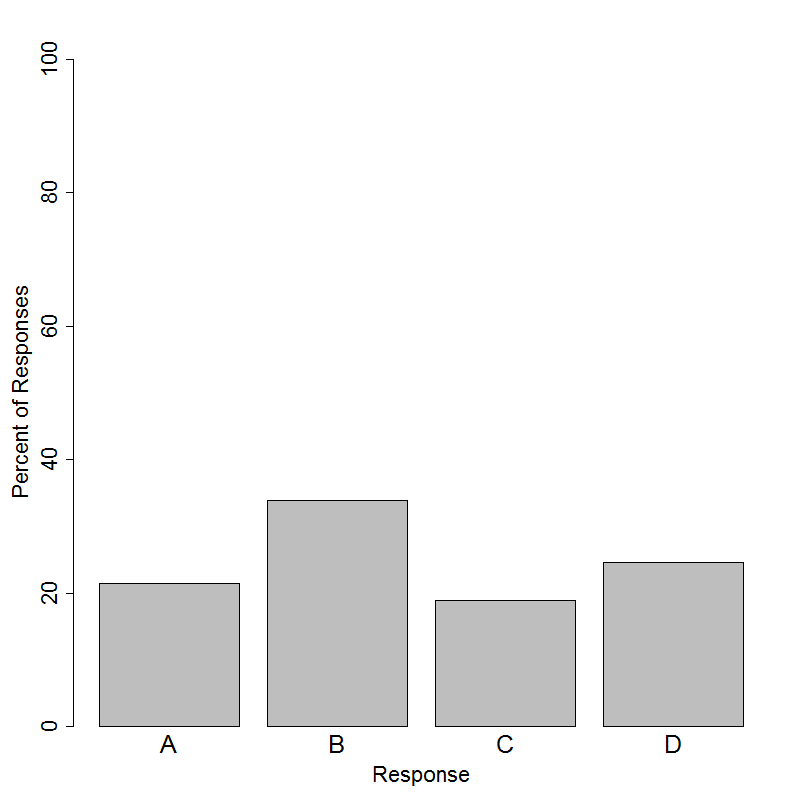
The correct answer to this item is Option (A). Only about 21% of students answered this item correctly. The Mean Absolute Deviation (MAD) is a measure of spread that takes into account how far away each data point is from the mean of the data. The mean of all of the distributions shown is 3. Therefore, the distribution with the highest MAD will be the one that has the most data points the furthest away from the mean. While this may not necessarily be easy to determine in ALL possible cases, it is possible given these distributions because the sample sizes are the same, the test scores are assumed to be discrete values, and the values are not binned into intervals. Since Option (A) has a large number of data points at the furthest values away from the mean, it will have the highest MAD.
Option (B) was the most popular distractor with a response rate of about 34%. Students may have selected Option (B) simply because it looks bell-shaped. In Option (B), much of the data is located at the mean unlike Option (A), so it must have a lower MAD than Option (A). Option (C) was selected by about 19% of students and is the distribution of the possible choices with the second highest MAD. This is because it also has a large number of data points that are located above and below the mean. Many students interpret a flat, uniform distribution to be “more spread out,” seeing it as having larger spread and, therefore, a larger MAD. However, since Option (A) has a majority of the data on the ends, it will have a higher MAD than Option (C). Option (D) had a response rate of about 25% even though this plot represents the lowest MAD of all of the distributions. In fact, the MAD of this distribution is 0 because all of the data points fall on the mean. Therefore, the average deviation from the mean is 0.