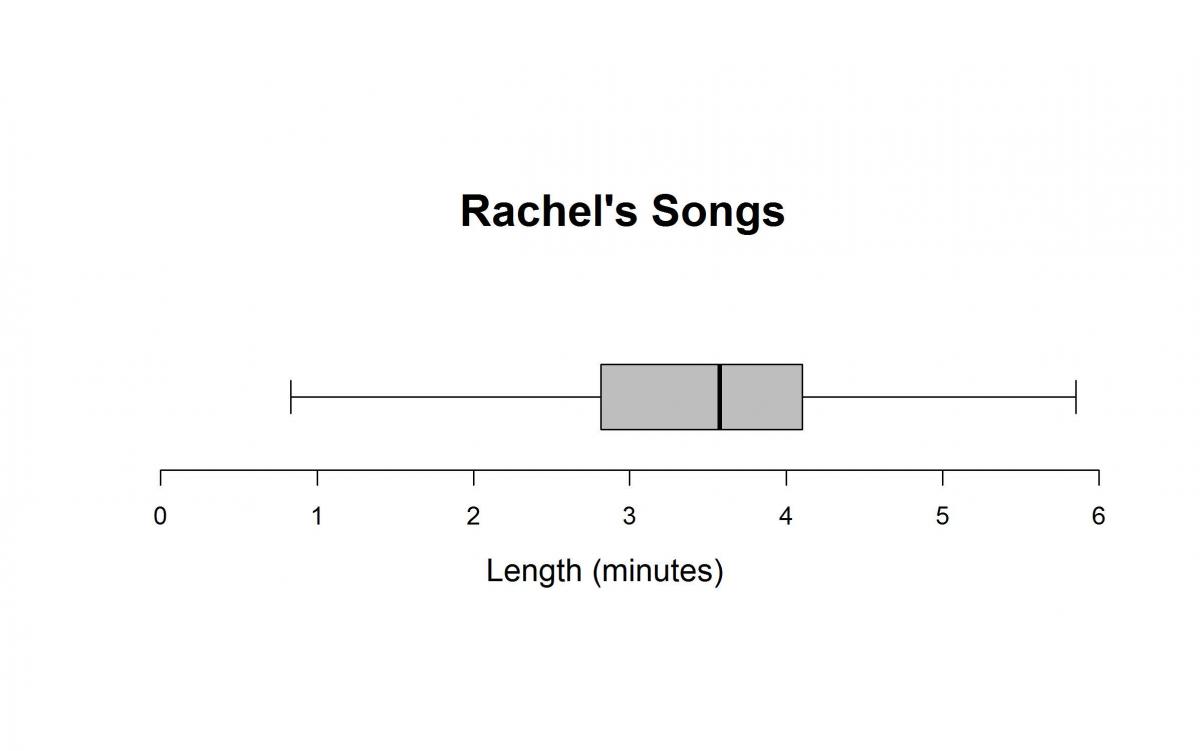
Rachel has a large number of songs on her music player. The song lengths, in minutes, are summarized in the boxplot below.
Rachel decided to listen to ten songs each morning. She set the music player to select the songs at random. The boxplots below summarize song lengths for Monday, Tuesday, and Wednesday of that week.
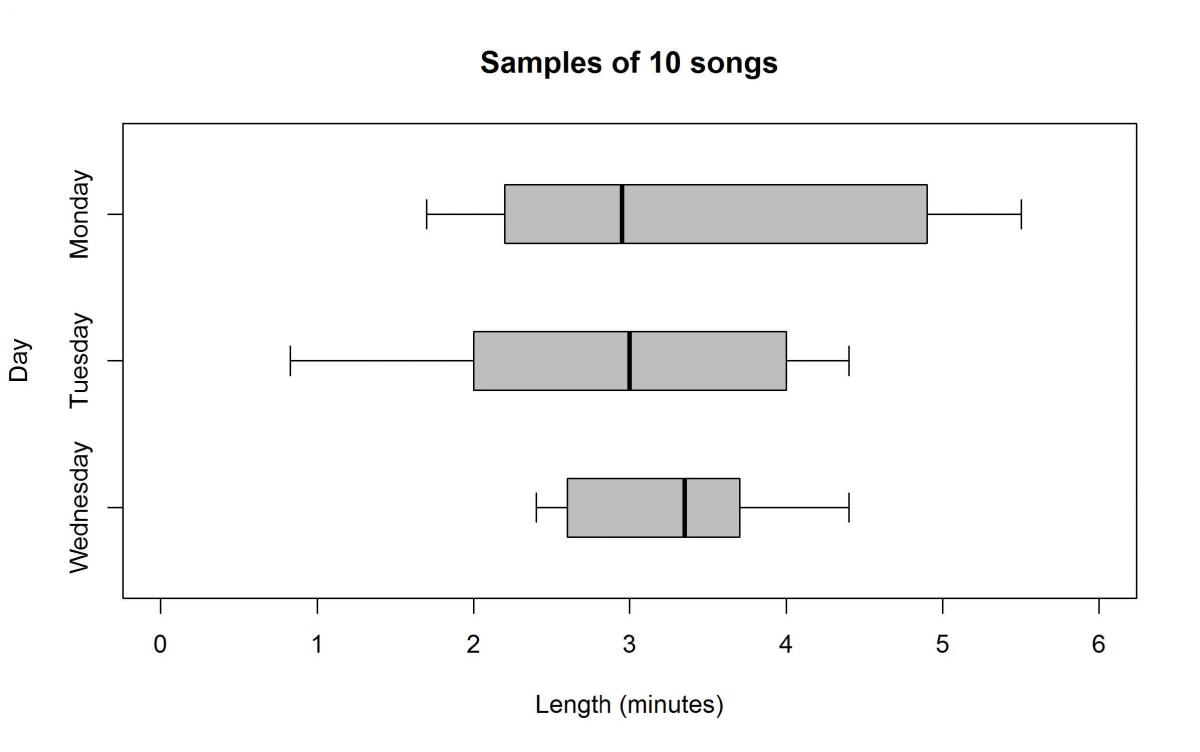
Which of the following statements is true?
(A) On Thursday, song lengths will have a greater median and less variability than song lengths from Wednesday.
(B) Something must be wrong with the music player, because the boxplots for Monday, Tuesday, and Wednesday all look very different.
(C) Something must be wrong with the music player, because the boxplots for Monday, Tuesday, and Wednesday are different than the population boxplot.
(D) The song lengths varied less on Wednesday than the song lengths on Monday or Tuesday.
Standards
6.SP.2: Understand that a set of data collected to answer a statistical question has a distribution which can be described by its center, spread, and overall shape.
6.SP.4: Display numerical data in plots on a number line, including dot plots, histograms, and box plots.
7.SP.2: Use data from a random sample to draw inferences about a population with an unknown characteristic of interest. Generate multiple samples (or simulated samples) of the same size to gauge the variation in estimates or predictions. For example, estimate the mean word length in a book by randomly sampling words from the book; predict the winner of a school election based on randomly sampled survey data. Gauge how far off the estimate or prediction might be.
S-ID.1: Represent data with plots on the real number line (dot plots, histograms, and box plots).
S-ID.3: Interpret di"erences in shape, center, and spread in the context of the data sets, accounting for possible e"ects of extreme data points (outliers).
Correct answer and commentary
Student performance
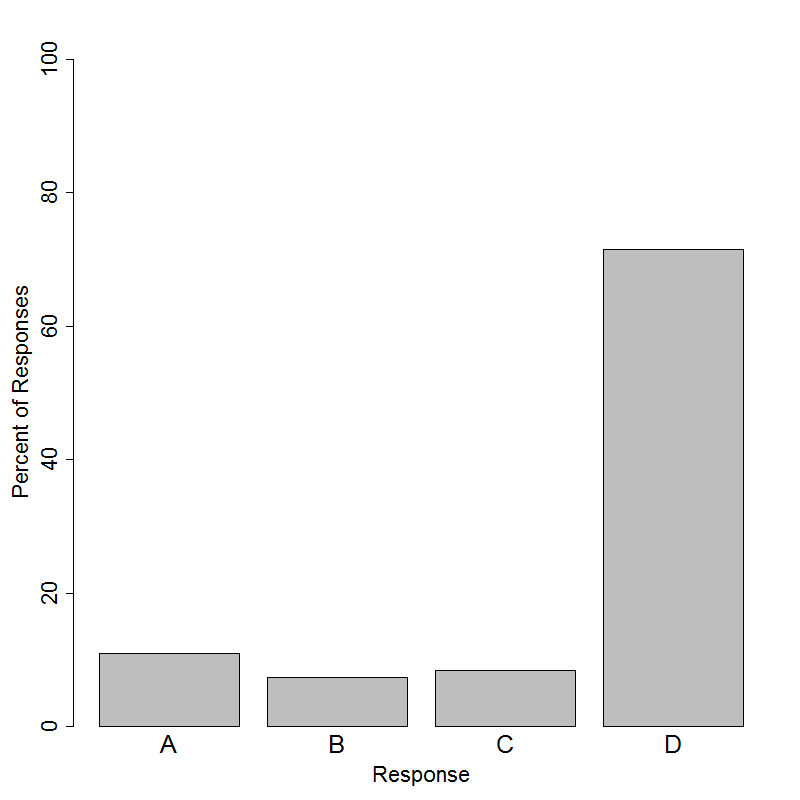
The correct answer to this question is Option (D). Both the range (the distance between the minimum and the maximum) and the interquartile range (IQR) (the length of the “box” that includes about 50% of the data points) are shorter on Wednesday than on Monday or Tuesday, which implies that the song lengths varied less on Wednesday. 71% of students answered this question correctly.
Option (A) is incorrect because it is based on a pattern in the way the medians and variability change across the random samples. In reality, one random sample is independent from another, so there is no reason to expect a pattern.
Options (B) and (C) both represent misunderstandings of sampling variability. When multiple samples are drawn from the same population, we do not expect the samples to look exactly the same as the population or exactly the same as each other. In this question, sampling variability is illustrated through boxplots: although each sample was drawn from the same population, the boxplots look somewhat different. We can also talk about the sampling variability in terms of numerical summaries. For example, the median song length varies from one sample to another.