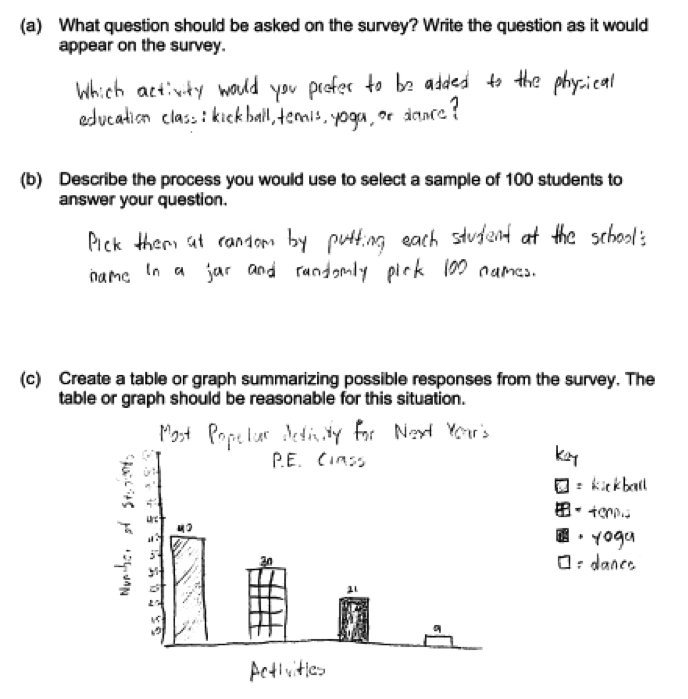
The student council members at a large middle school have been asked to recommend an activity to be added to physical education classes next year. They decide to survey 100 students and ask them to choose their favorite among the following activities: kickball, tennis, yoga, or dance.
(a) What question should be asked on the survey? Write the question as it would appear on the survey.
(b) Describe the process you would use to select a sample of 100 students to answer your question.
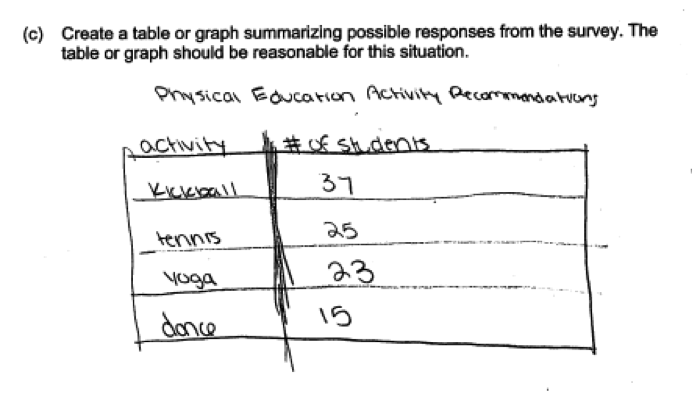
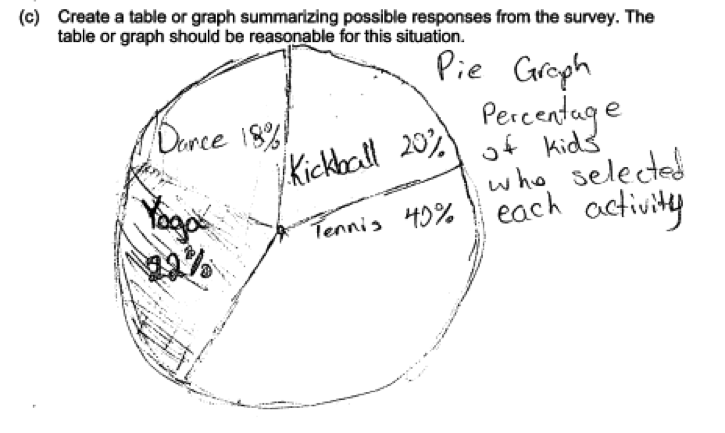
(c) Create a table or graph summarizing possible responses from the survey. The table or graph should be reasonable for this situation.
(d) What activity should the student council recommend be added to physical education classes next year? Justify your choice based on your answer to part (c).
Overview of the question
This question is designed to assess the student’s ability to:
1. Write an appropriate survey question (part (a)).
2. Describe a reasonable way to select a random sample of students (part (b)).
3. Create a table or graph appropriate for the categorical data collected (part (c)).
4. Use data summarized in the table or graph to draw a conclusion (part (d)).
Standards
- 6.SP.1: Recognize a statistical question as one that anticipates variability in the data related to the question and accounts for it in the answers. For example, “How old am I?” is not a statistical question, but “How old are the students in my school?” is a statistical question because one anticipates variability in students’ ages.
- 6.SP.4: Display numerical data in plots on a number line, including dot plots, histograms, and box plots.
- 6.SP.5a: Summarize numerical data sets in relation to their context, such as by: Reporting the number of observations.
- 7.SP.1: Understand that statistics can be used to gain information about a population by examining a sample of the population; generalizations about a population from a sample are valid only if the sample is representative of that population. Understand that random sampling tends to produce representative samples and support valid inferences.
- 7.SP.2: Use data from a random sample to draw inferences about a population with an unknown characteristic of interest. Generate multiple samples (or simulated samples) of the same size to gauge the variation in estimates or predictions. For example, estimate the mean word length in a book by randomly sampling words from the book; predict the winner of
a school election based on randomly sampled survey data. Gauge how far off the estimate or prediction might be.
Ideal response and scoring
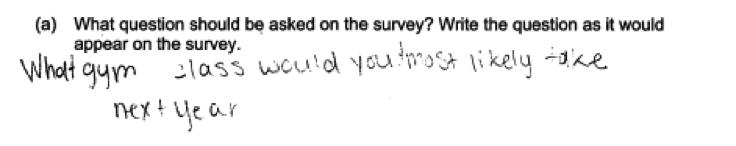
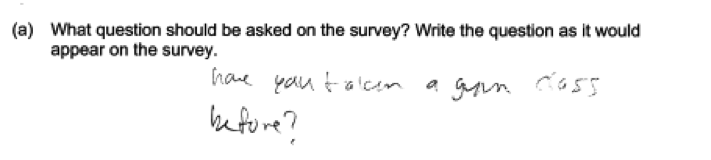
Part (a):
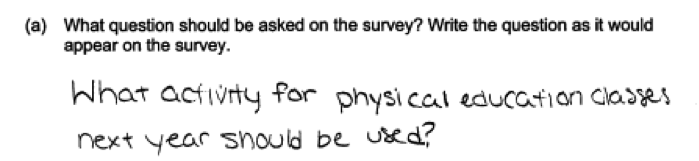
Part (a) asks students to write a question that could be used as part of a survey. The goal is to collect data in order to make a recommendation about which activity (kickball, tennis, yoga or dance) should be added to PE classes at the middle school.
An ideal response to part (a) is one that provides a clearly written question that would provide data that would allow the student to make an informed recommendation. Responses that give a question that would result in relevant data but which are incomplete or unclear are considered to be partially correct.
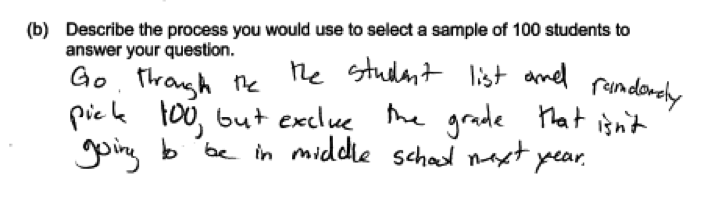
Part (b):
An ideal response to part (b) recognizes the need for random sampling and clearly describes a process that would result in a random sample from an appropriate population. Responses that recognize the need for random sampling but which do not provide a clear description of a process that would be implemented based on the given description are considered to be partially correct. Responses that provide a description for selecting a random sample but select the sample from a population other than the one described in the question are also considered to be partially correct. Responses that describe convenience samples that do not involve any type of random selection are considered to be incorrect.
Parts (c) and (d):
Parts (c) and (d) are scored together as one part. An ideal response recognizes that the survey data will be categorical and chooses a table or graphical display appropriate for categorical data, such as a frequency table, a bar chart or a pie chart.
If a graphical display is used, it must include appropriate scales and labels. The ideal response also includes a recommendation about which activity to add to PE classes that is consistent with and clearly linked to the graph or table provided.
A response that contains only one of the two components described (correct table or graph, appropriate conclusion with justification) is considered to be partially correct.
Sample responses indicating solid understanding
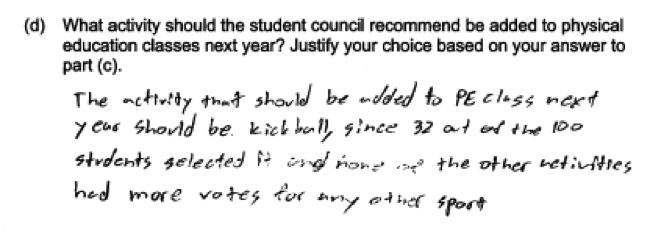
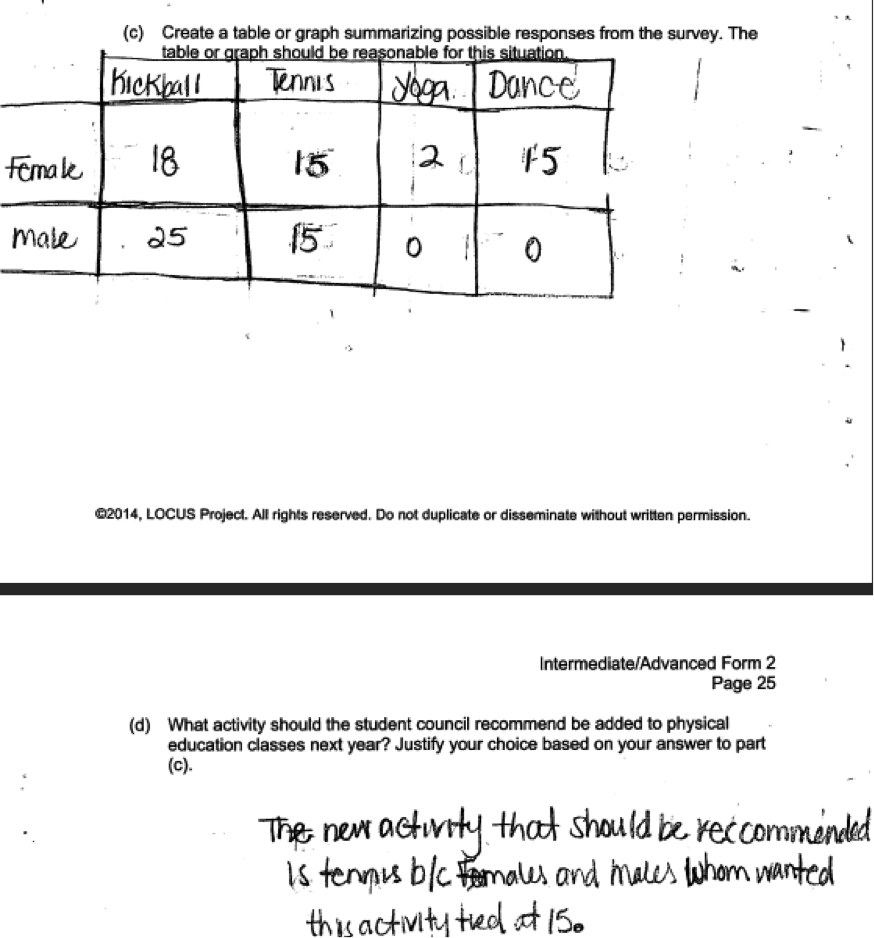
The following student response shows a good understanding of the concepts assessed by this question and received a score of 4. The survey question given in part (a) is clearly written and would result in data that could be used to answer the question of interest, and was scored as essentially correct. The response to part (b) needs to include a method for representing each individual in the population, a random method for selecting individuals for the sample that can be implemented, and assurance that an individual can be selected only once. Although the student’s response to part (b) might have provided a bit more detail (such as making it clear that that the names would be mixed prior to selection of names from the jar), it does specify a procedure that would result in a random sample, and part (b) was scored as essentially correct. A bar graph was produced in part (c) that includes appropriate labels and scales and the relative frequencies sum to 100%. The conclusion in part (d) is consistent with the bar chart in part (c) and is justified based on the bar chart. Parts (c) and (d) scored together were considered essentially correct. With all three parts essentially correct, this student response received a score of 4.
The response above used a bar chart in part (c), but using a frequency table or a pie chart are also acceptable ways to summarize the categorical data. The following examples from two other student papers illustrate a response that uses a table and a response that uses a pie chart, respectively. Even though the first example does not report relative frequencies, it could result in a score of essentially correct if the thre response to part (d) includes a justification that is consistent with the table (e.g., “kickball, because it has the most”).
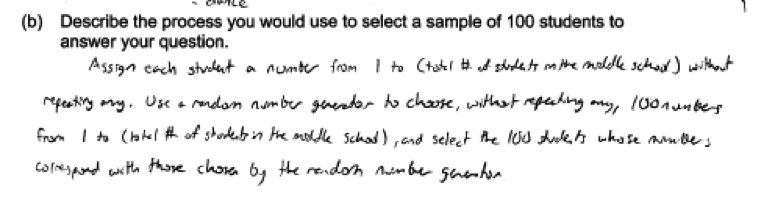
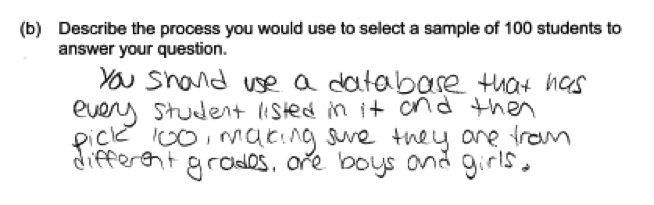
While many students described a sampling process that involved writing the names of students at the school on slips of paper, putting them into a container, mixing and then selecting 100 slips of paper from the container, some student described a process that used a list of students and random numbers to select the students for the sample. This is also a correct approach, and the following student response illustrates this approach.
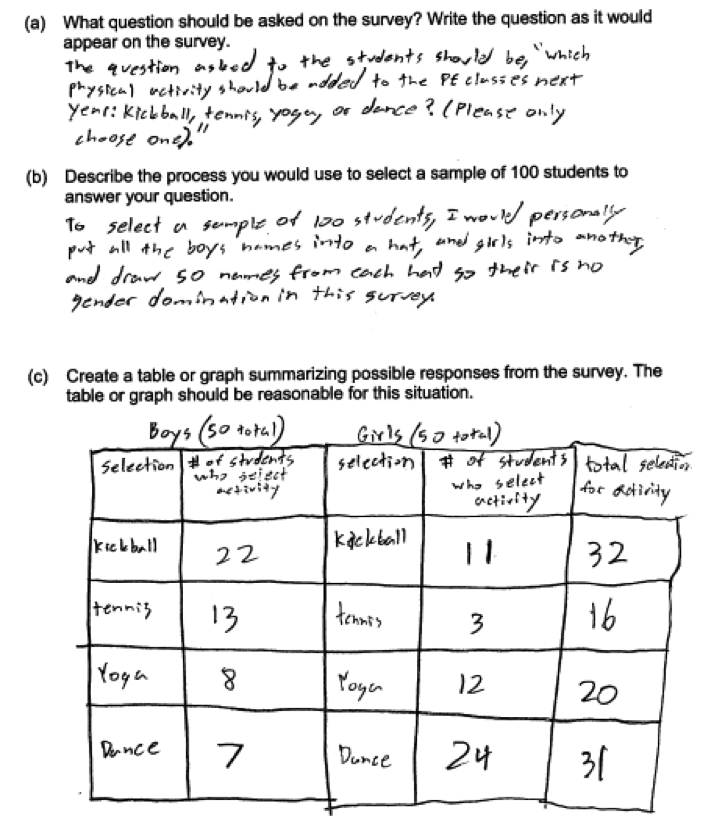
Some students chose to stratify the population (divide into subgroups) based on sex or grade level and then select a random sample from each of these groups. While not required, this is also an acceptable approach as long as random samples are selected from each subgroup and the table or graph in part (c) and conclusion in part (d) are appropriate. The student response below proposes a sampling method that stratifies by sex, and also received a score of 4. Note: There is an arithmetic error in the kickball row as the total should be 33. This was not viewed as an error that took away from statistical understanding.
Common misunderstandings
Part (a) asked students to write an appropriate survey question.
Most students were able to write a reasonable survey question in part (a), but some questions were incomplete or vague. The following two responses illustrate this and were scored as only partially correct for part (a).
 Some questions, like the one in the student response below, would not have resulted in data that could be used to answer the question posed. Responses like this were scored as incorrect for part (a).
Part (b) asked students to describe a reasonable way to select a sample of students.
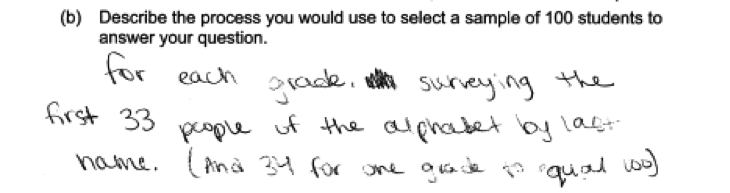
There were two common errors in the student responses to part (b). The first was failure to provide sufficient detail when describing the process for selecting a sample. To be considered essentially correct, the description of the process needed to provide enough detail so that someone who read the description could actually implement the process. The following are examples of student responses that were scored as only partially correct because they recognized the need for random selection, but provided insufficient detail in the description of the process.
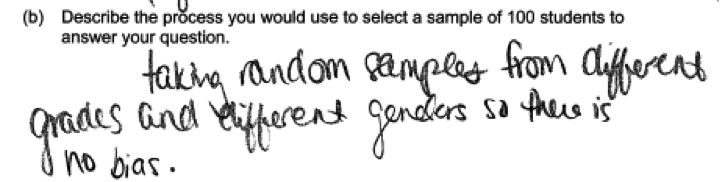
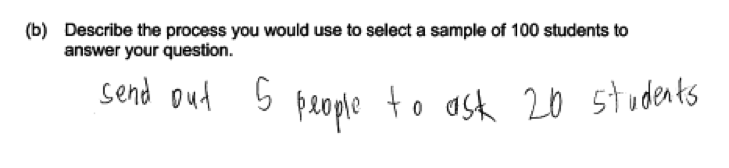
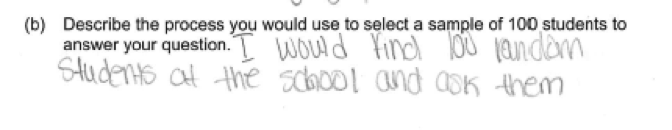 A second common error was to fail to recognize the role that random selection should play in the selection of the sample and to describe a method that would result in a convenience sample that might not be representative of the population of interest. Three responses that make this error and were scored as incorrect for part (b) are shown below.
There were several common ways that a student’s response to either part (c) or (d) was considered to not be essentially correct.
Part (c) asked students to create a table or graph that would be appropriate for the type of data collected.
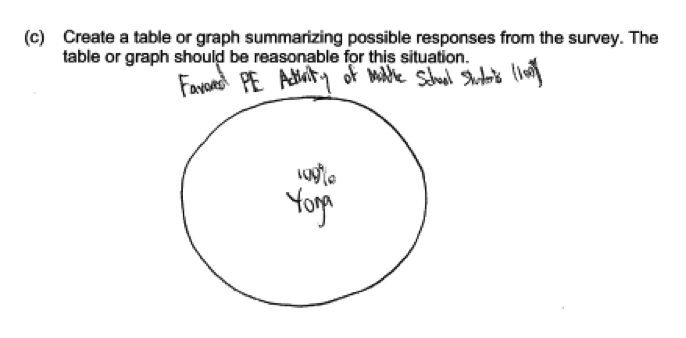
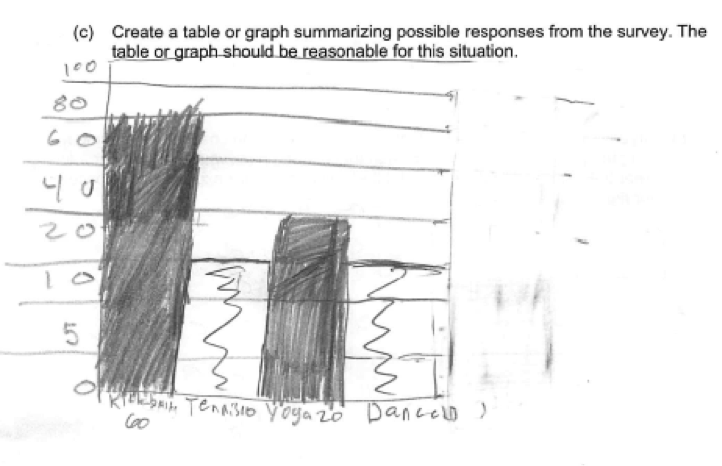
Most students produced reasonable tables or graphical displays in part (c). A few students did not anticipate variability in the data and produced a graphical display that was not realistic, such as the one shown in the response below.
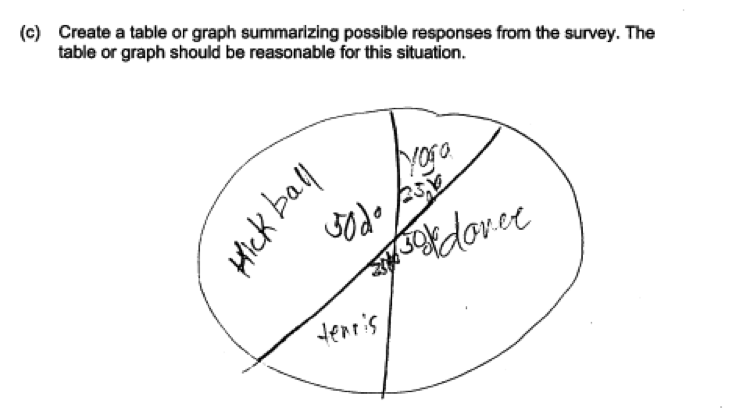
 Some graphs produced were not realistic in other ways, such as the response below where the percentages add up to 150% and the areas in the pie chart are not proportional to the percentages being represented.
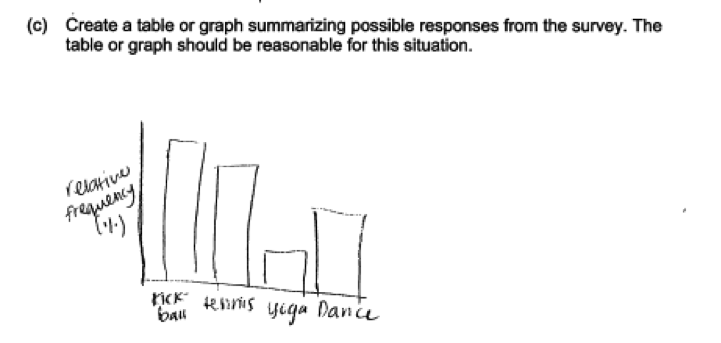
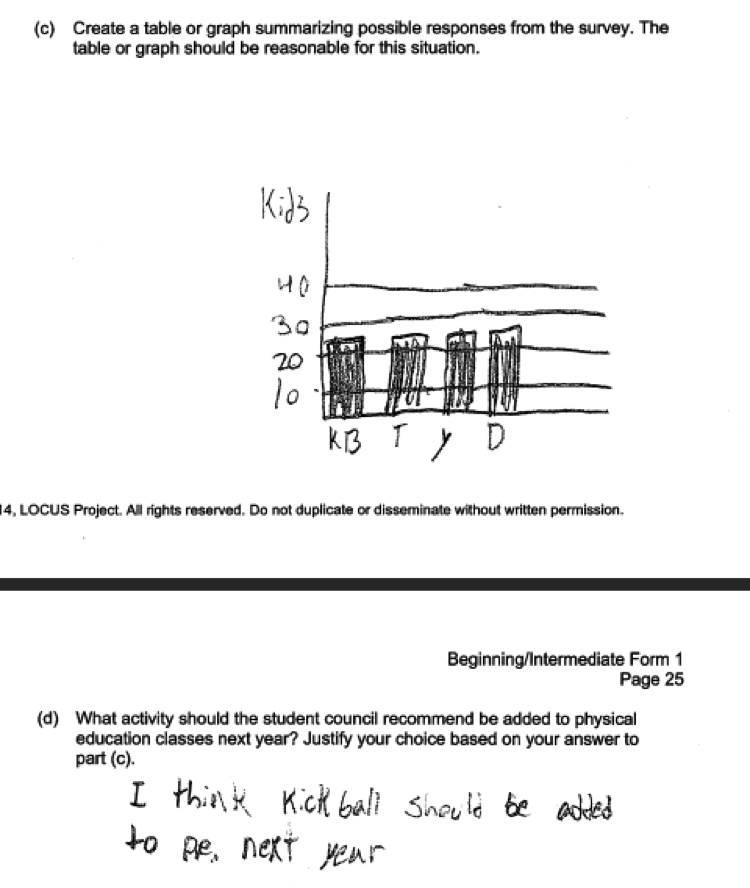
 Many students did not recognize the need to add scales in the graphs that they produced, as shown in the two responses below.
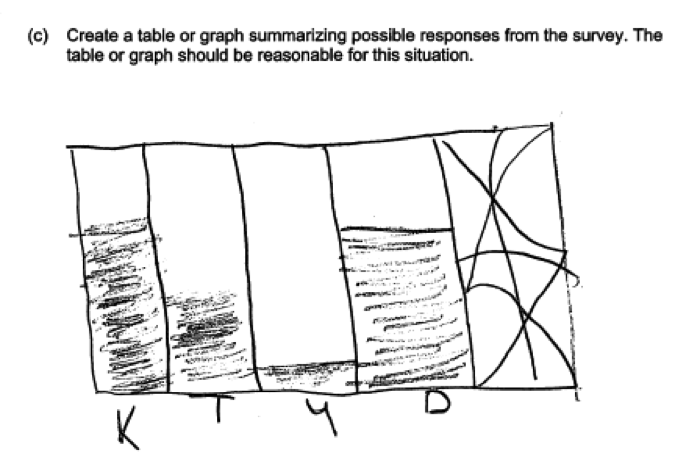 Others added a scale, but the scale was not correct. For example, consider the student response below, where the scale increases by 5, then by 10 and then by 20, but the spacing between the scale labels does not change.
Part (d) asked the students to use the data summarized in the table or graph produced for part (c) to draw a conclusion.
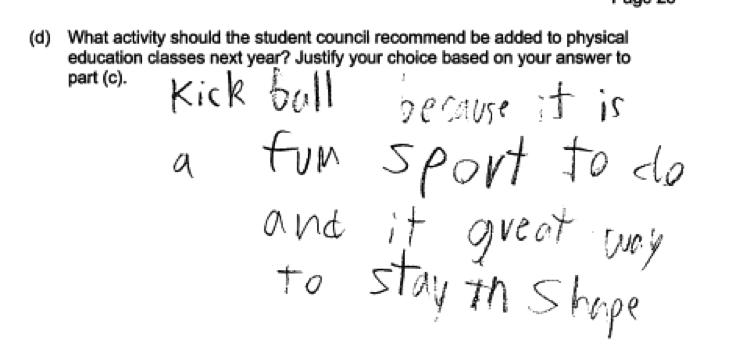
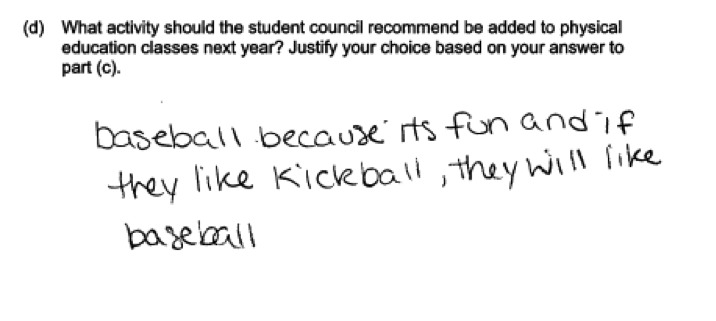
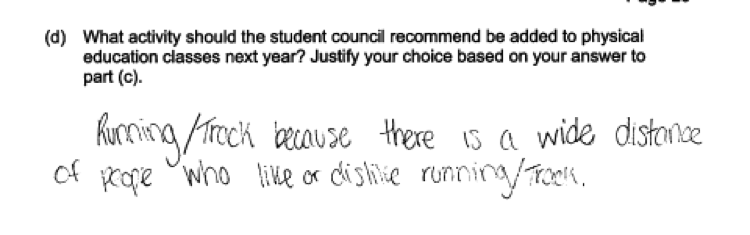
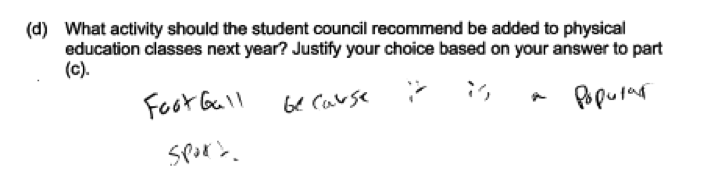
Most students drew a correct conclusion based on the table or graph they constructed in part (c). However some students failed to justify their choice based on the table or graph even though the question specifically asked for this. Others made recommendations that were inconsistent with the part (c) response or that were based on incorrect reasoning. This is illustrated in the two responses that follow.
A more common mistake was to ignore the instructions to make and justify a recommendation based on the response to part (c), often naming an activity that was not one of those given in the question as a possibility. Many students responded with their own personal beliefs, as illustrated in the responses that follow, which does not demonstrate a need to make an argument based on or supported by data.
Student performance
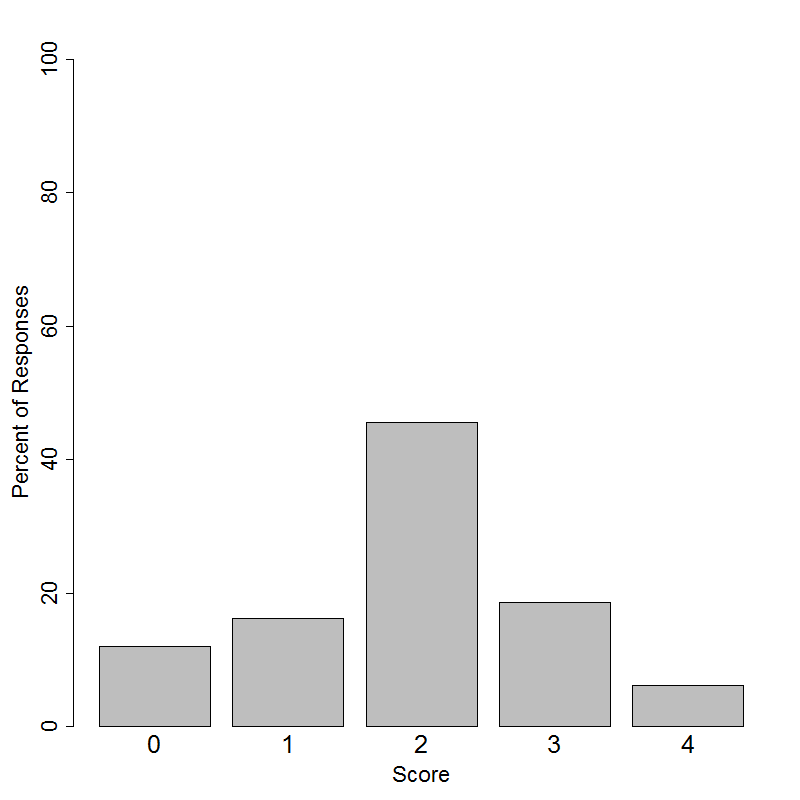
This item was administered to students in grades 6-12. Students in grades 6-9 had the following distribution of scores on a 4-point scale.
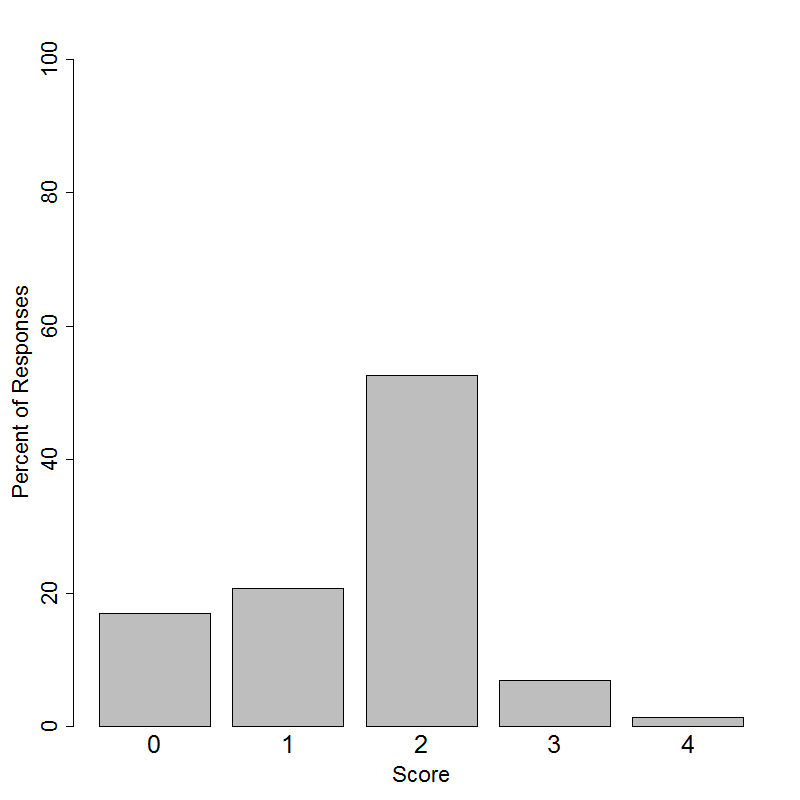
Students in grades 10-12 had the following distribution of scores on a 4-point scale.
Resources
An understanding of the need for random selection when taking a sample from a population of interest is critical because it forms the basis for the methods for drawing conclusions from data that students encounter in the K-12 curriculum. An ideal response to this question requires this understanding as well as knowledge of appropriate ways to summarize categorical data. More information about these topics can be found in the following resources.
Free Resources
Classroom and Assessment Tasks
- Illustrative Mathematics has peer reviewed tasks that are indexed by Common Core Standards. A task that focuses on the need for random selection in sampling and could be the basis of a productive classroom discussion is
Guidelines for Assessment and Instruction in Statistics Education (GAISE)
- Published by the American statistical Association and available online, this document contains an example titled “Choosing the Band for the End of Year Party—Conducting a Survey” that is similar in content to this question. This example can be found on pager 21 – 27.
Common Core Progressions Documents
- A discussion of the intent of Common Core standard S.IC.3 and how this content might be developed in the classroom can be found in Common Core Tools progressions document for statistics in grades 6 - 8. See the discussion of random sampling under standard 7.SP.1 on pages 8 – 9.
Resources from the National Council of Teachers of Mathematics
The NCTM publication Developing Essential Understanding of Statistics for Teaching Mathematics in Grades 6 – 8 includes a section on displaying distributions of categorical data on pages 13 – 19 and a discussion of simple random sampling on pages 73 – 75.