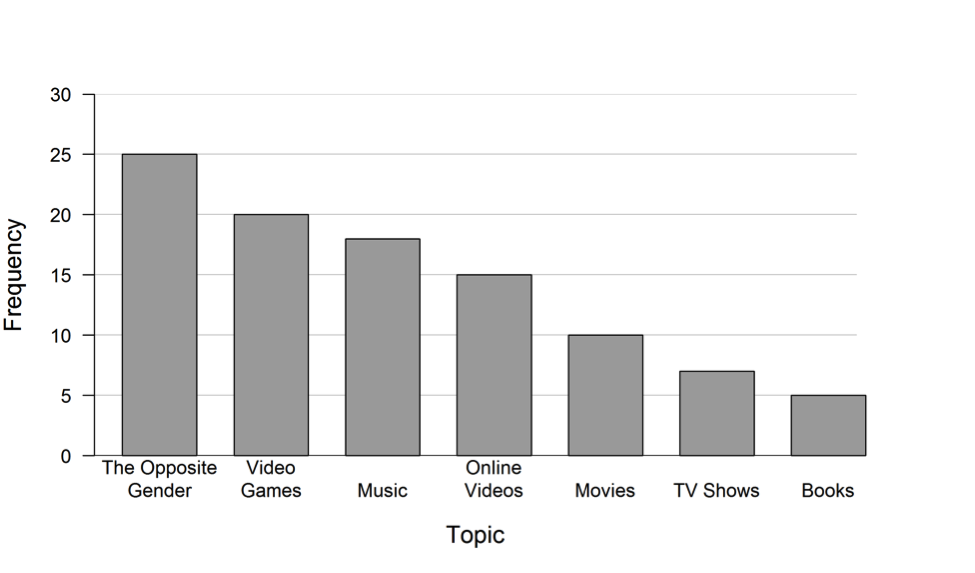
One hundred middle school students from Atlanta, Georgia, were asked:
What do you most like to talk about with your friends?
The data from the survey are summarized in the frequency table and bar graph below.
| Topic | Frequency |
| The Opposite Gender | 25 |
| Video Games | 20 |
| Music | 18 |
| Online Videos | 15 |
| Movies | 10 |
| TV Shows | 7 |
| Books | 5 |
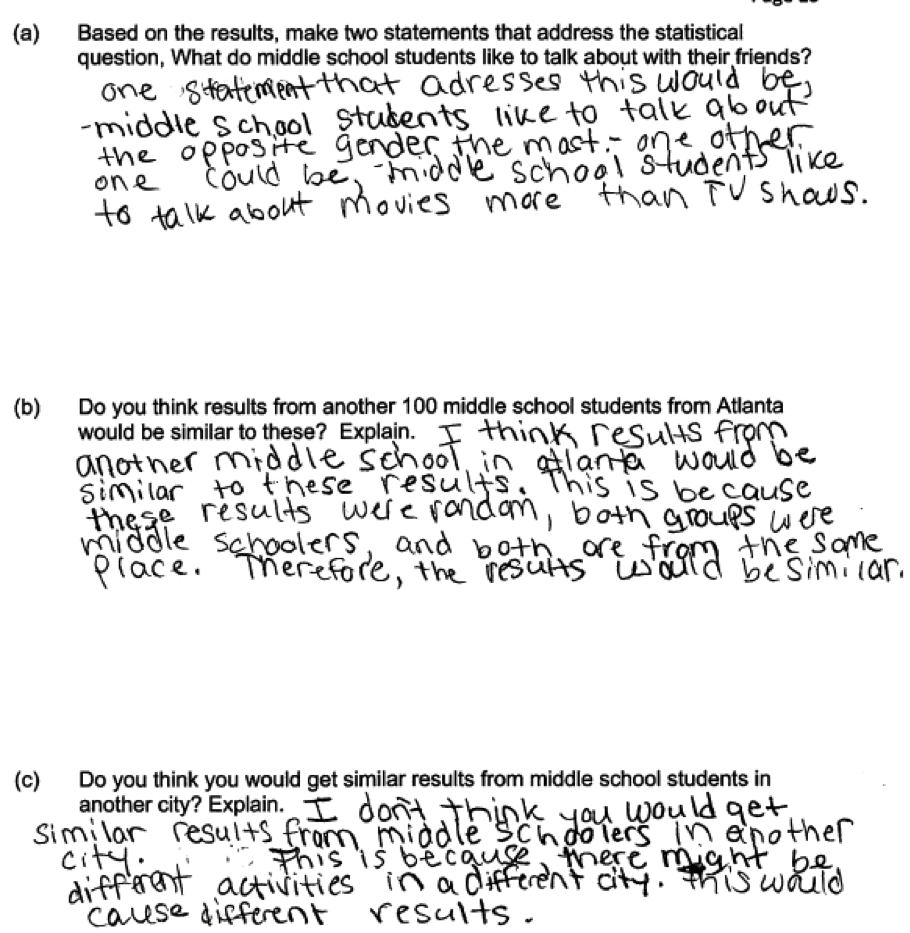
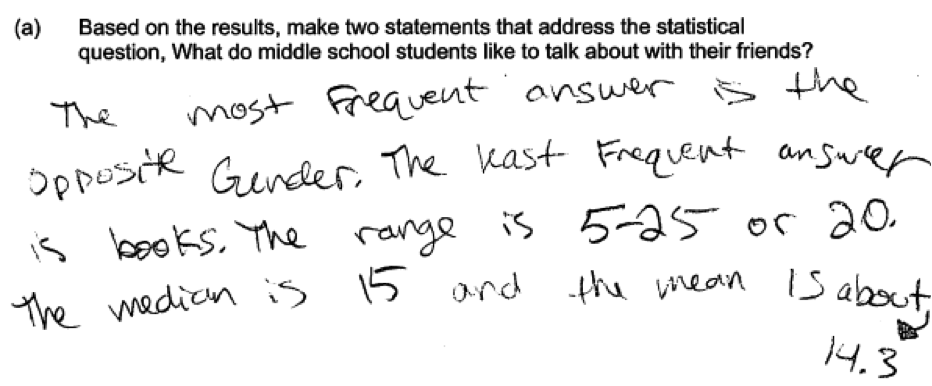
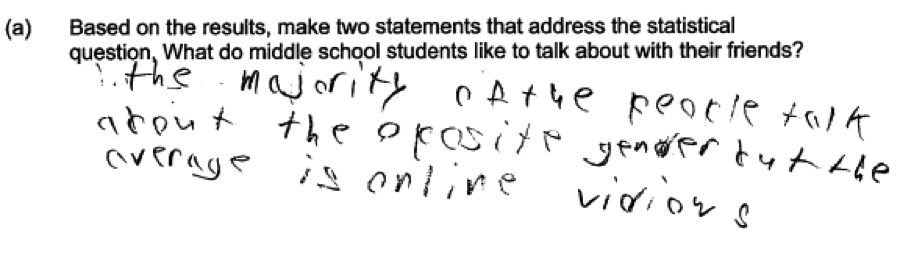
 (a) Based on the results, make two statements that address the statistical question, What do middle school students like to talk about with their friends?
(b) Do you think results from another 100 middle school students from Atlanta would be similar to these? Explain.
(c) Do you think you would get similar results from middle school students in another city? Explain.
Overview of the question
This question is designed to assess the student’s ability to:
1. Use categorical data that have been summarized in a frequency table and a bar graph to answer a statistical question (part (a)).
2. Understand that generalizing from a sample to a larger population is reasonable only if the sample is representative of the population. (parts (b) and (c)).
Standards
6.SP.2: Understand that a set of data collected to answer a statistical question has a distribution which can be described by its center, spread, and overall shape.
7.SP.1: Understand that statistics can be used to gain information about a population by examining a sample of the population; generalizations about a population from a sample are valid only if the sample is representative of that population. Understand that random sampling tends to produce representative samples and support valid inferences.
Ideal response and scoring
Part (a):
Part (a) asks students to use data that from a survey of middle school students in Atlanta to answer a statistical question. There are many different possible statements that students might make as they use the given table and bar graph to comment on what middle school students like to talk about with their friends. Ideally, the response would comment on the most common response (the mode, which is the response of “the opposite gender”), but any two reasonable statements are acceptable. The statements made should be directly linked to information in either the frequency table or the bar graph.
Responses that include two or more correct statements but which also include statements that are incorrect based on the given table and graph are considered partially correct for part (a). Responses that interpret the frequencies as if they were numerical data values and compute summary statistics only appropriate for numerical data (such as the mean or median) represent a conceptual error in thinking about the underlying data and are considered to be incorrect for part (a), even if accompanied by other correct statements.
Part (b):
There are a several correct ways that a student might answer part (b). An ideal response to part (b) indicates an understanding that the results from another sample of middle school students in Atlanta would not be identical to the results of the given survey. The problem did not state that the sample was a random sample, but many students assumed that this was the case. A response that indicates that two random samples of Atlanta middle school students would be likely to produce similar results is considered essentially correct. Also considered essentially correct are responses that indicate that because the sample was not a random sample, the results in another sample might be quite different from the results of the given sample. A response that indicates that responses from two random samples will be identical demonstrates a misunderstanding of the concept of sampling variability and is considered to be incorrect for part (b).
Part (c):
An ideal response to part (c) demonstrates an understanding that it is only appropriate to generalize results from a sample to the population from which the sample was selected. To be considered essentially correct, a response to part (c) must provide a clear explanation of why it is not reasonable to generalize to middle school students in a different city. Responses that indicate that another city might be different but for which the explanation is incomplete or poorly communicated is considered to be only partially correct for part (c).
Sample responses indicating solid understanding
The following student response shows a good understanding of the concepts assessed by this question and received a score of 4. In part (a) the response includes a statement about the most common response (“like to talk about the opposite gender the most”) and also includes a second statement that is correct for the given table and bar chart (“like to talk about movies more than TV shows”).
The response in part (b), the student assumes that the given data were from a random sample and then uses that as a justification for why the results would be similar in a different sample. Although the response would have been stronger if the student had said “these results were from a random sample” rather than “these results were random,” the response was still scored as essentially correct for part (b).
The response in part (c) was also scored as essentially correct because it indicates that the results are expected to be different in another city and gives a plausible reason why it is not reasonable to think that another city would be like Atlanta.
Common misunderstandings
Part (a) Use categorical data that have been summarized in a frequency table and a bar graph to answer a statistical question
Most students provided correct responses to part (a) of this question. Responses that were not scored as essentially correct for part (a) generally made one of three common mistakes. The most concerning of these mistakes is illustrated by the following two student responses. In these responses, the student interprets the frequencies as if they were numerical data values and compute summary statistics only appropriate for numerical data (such as the mean or median). This represents a conceptual error in thinking about the underlying data, which is categorical. In the first response below, the range, median and mean of the 7 given frequencies have been computed, and these measures have no meaning in the context of categorical data. In the second response below, the student says “the average is online videos,” probably basing this statement on the fact that the frequency of 15 is closest to the average of 14.3 obtained when the frequencies are averaged. These two responses were both considered incorrect for part (a).
 A second error that occurred in a number of papers was most likely the result of not reading the question carefully. The question asks for two statements that address the question “What do middle school students like to talk about with their friends?” Some students did not provide statements and just gave a poorly communicated answer to the question itself. This is illustrated by the following student response, which was scored as incorrect for part (a).
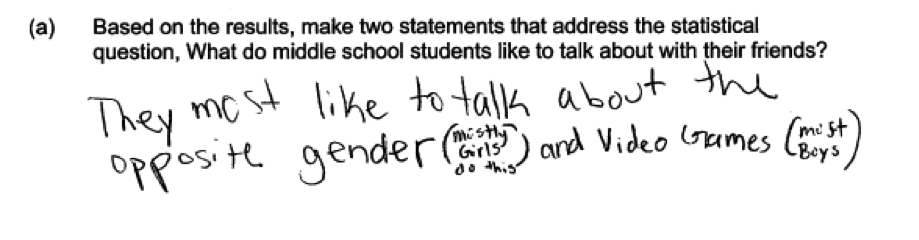
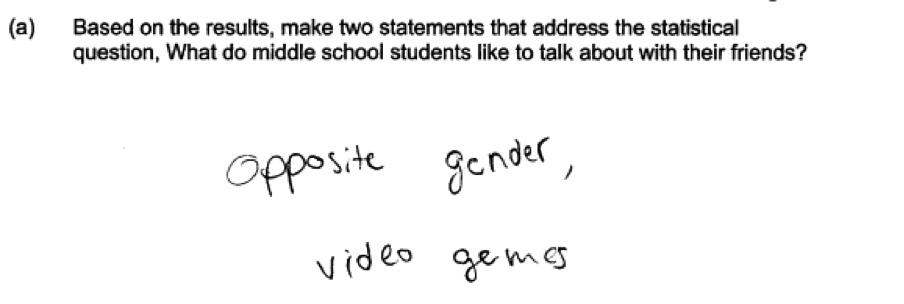 The third common error in part (a) occurred in responses that actually did provide two correct statements, but then went on to provide one or more additional statements that were not correct or that could not be inferred from the given table or bar graph. Depending on the error in the incorrect statement, such responses are considered to be either partially correct or incorrect for part (a). For example, the following response was scored as only partially correct for part (a) because the statements about “mostly girls do this” and “most boys” do not follow from either the table or graph and are based on personal opinion.
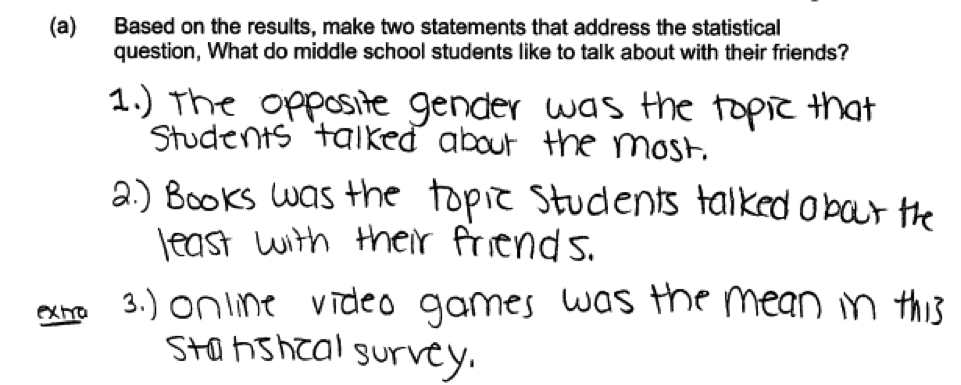
 The following response includes two correct statements, but then follows them with an “extra” statement that is incorrect and is an example of the conceptual error previously described where frequencies are treated as the data. For this reason, this response was scored as incorrect for part (a).
Parts (b) and (c) Understand that generalizing from a sample to a larger population is reasonable only if the sample is representative of the population.
Parts (b) and (c) both address the concept of sampling variability and when it is reasonable to generalize from a sample to a larger population.
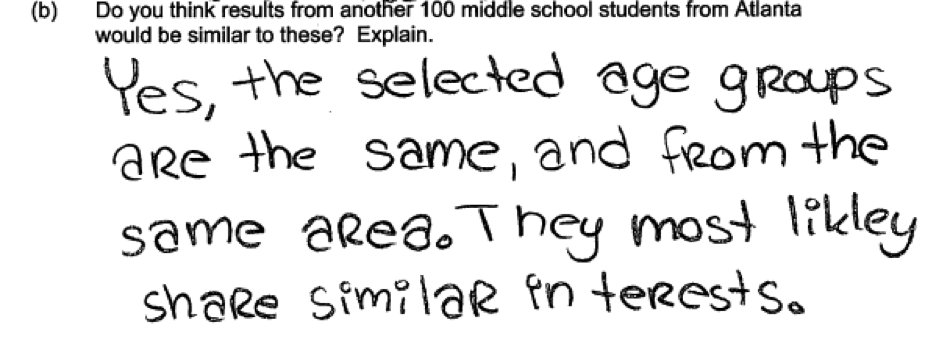
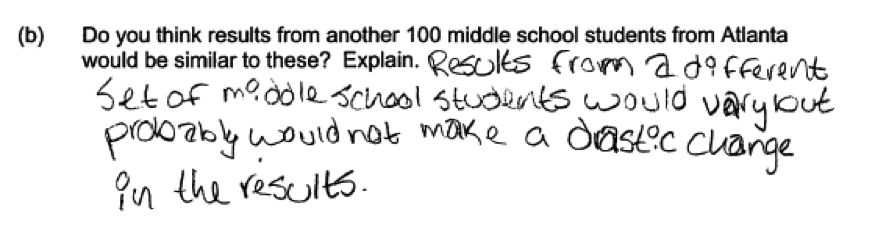
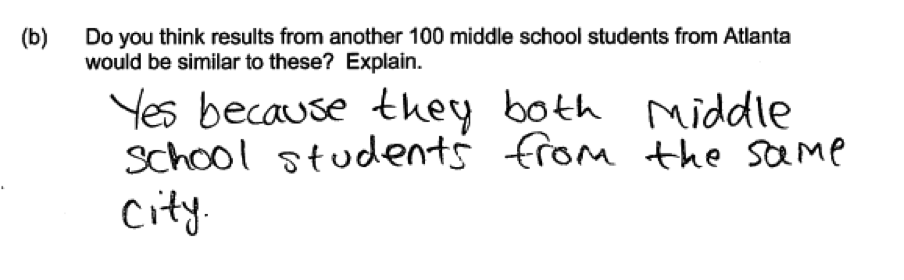
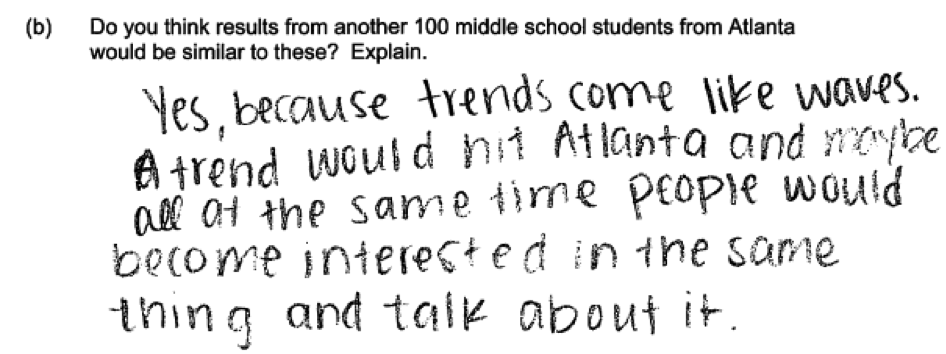
For a correct response in part (b), students could either indicate that they would expect the results to be similar in a different sample as long as the samples were random samples or that they would not expect the results to be similar because it was not stated that the samples were randomly selected. In either case, the explanation includes a reference to the way the samples were selected. One common error in responding to part (b) was to indicate that the results for the two samples would be similar, but not justifying this by addressing the role that the sampling method plays. The following four responses illustrate this error by their failure to acknowledge the role of sampling method.
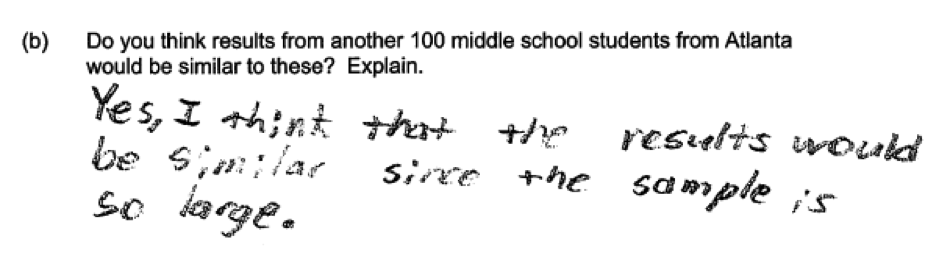
 A different, but also concerning, common conceptual error is illustrated in the following student response to part (b). This response illustrates the error of believing that any sample is representative as long as the sample size is large. This response was scored as incorrect for part (b) and is typical of student responses making this error.
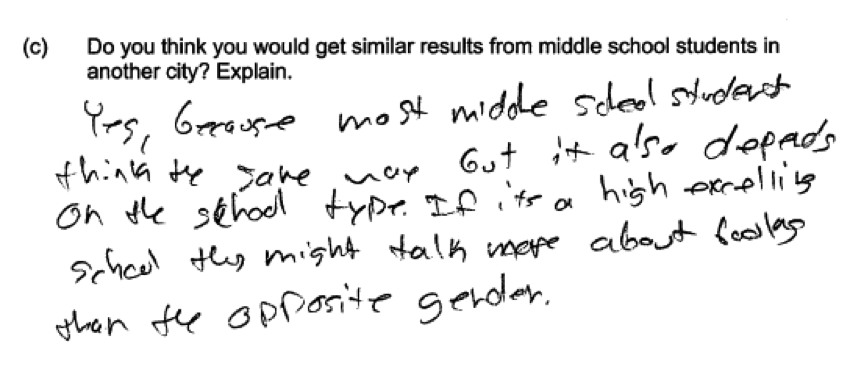
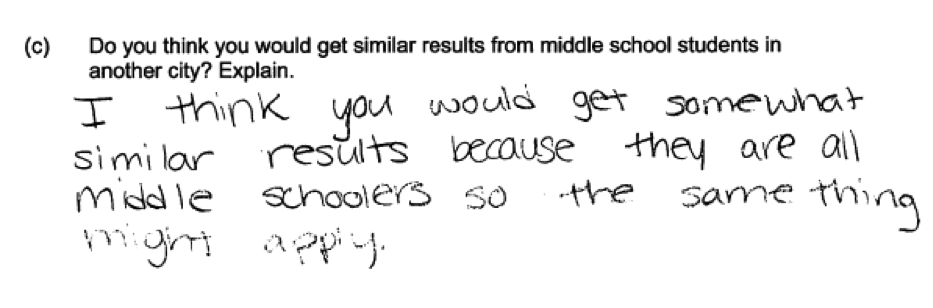
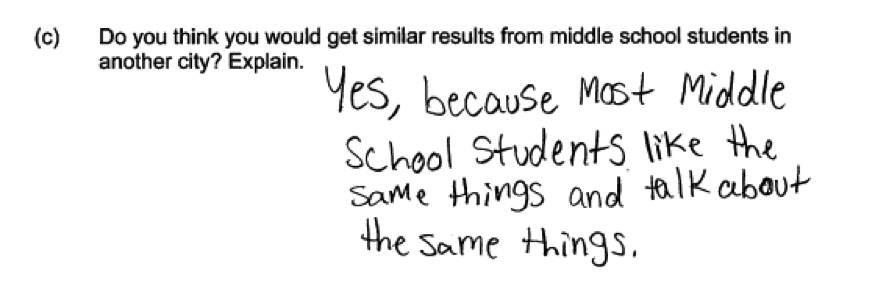
 In part (c), the most common conceptual error was failure to recognize that even with a large random sample, it is only appropriate to generalize from a sample to the population from which the sample was selected. This is illustrated by the following three responses that all make indicate that results would be similar in a different city and justify this response by arguing that middle school students in other cities would talk about the same things. While the first response points out a reason why the result at a different school might be different (“If it is a high excelling school they might talk more about books than the opposite gender”), this statement is not linked to the sample being selected in a different city.
Resources
More information about the topics assessed in this question can be found in the following resources.
Free Resources
Lessons
Statistics Education on the Web (STEW) has peer reviewed lessons plans. Some lessons related to the topic of this question are:
Candy Judging (interpreting bar graphs)
The Gumball Machine (introduction to sampling variation)
Classroom and Assessment Tasks
Illustrative Mathematics has peer reviewed tasks that are indexed by Common Core Standard.
A task that could be the basis of a classroom discussion of sampling variation is
Guidelines for Assessment and Instruction in Statistics Education (GAISE)
Published by the American Statistical Association and available online, this document contains a discussion of the importance of random selection (pages 52 – 54).
Resources from the American Statistical Association
Bridging the Gap Between Common Core State Standards and Teaching Statistics is a collection of investigations suitable for classroom use. This book contains an investigation that involves interpreting bar graphs (What Colors Are Our Shore?, pages 28 – 36). Questions 1 and 2 on page 34 are very similar to the questions posed in this Locus question. There is also another investigation that involves the interpretation of bar graphs (What is the Chance of Seeing an Elephant at the Zoo?, pages 222 – 230). Although this investigation is in the context of using data to estimate a probability, it also involves using a bar graph to answer questions that are similar to those posed in this Locus question.