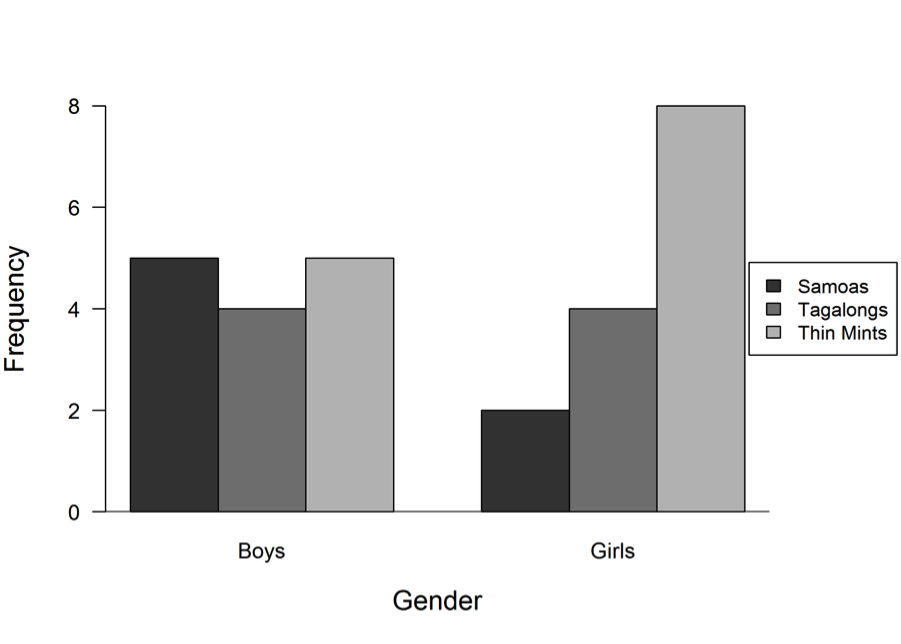
Samoas, Tagalongs, and Thin Mints are the most popular types of Girl Scout cookies in a school. Students in a sixth-grade class wanted to know which of these three types of cookies their classmates like the most. They also wanted to know how the popularity of these three types of cookies compared between boys and girls. Data from a class survey are summarized in the bar graphs below.
 (a) Which of these three types of cookies was most popular for the class? Justify your response.
(b) Which of these three types of cookies was least popular for the class? Justify your response.
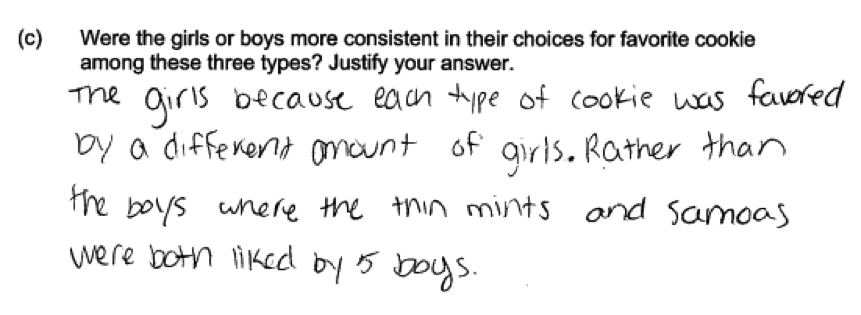
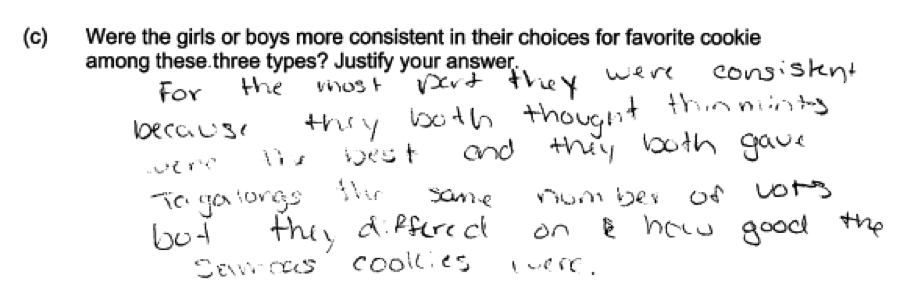
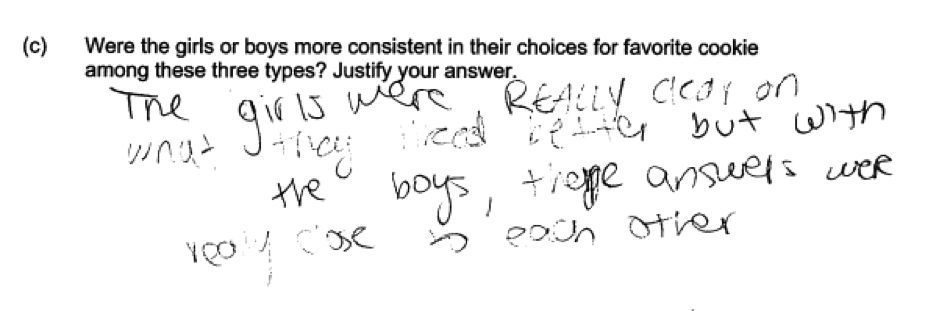
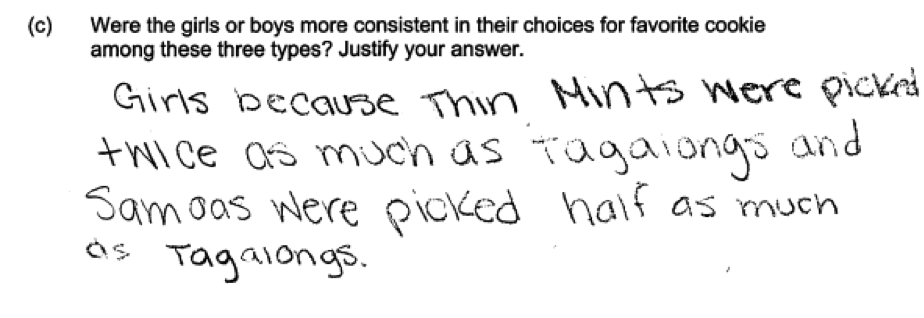
(c) Were the girls or boys more consistent in their choices for favorite cookie among these three types? Justify your answer.
Overview of the question
This question is designed to assess the student’s ability to:
1. Use categorical data that have been summarized in a bar graph to answer questions about the data distribution of a categorical variable (parts (a) and (b)).
2. Recognize and describe variability in the distribution of a categorical variable (part (c)).
Standards
6.SP.2: Understand that a set of data collected to answer a statistical question has a distribution which can be described by its center, spread, and overall shape.
7.SP.4: Use measures of center and measures of variability for numerical data from random samples to draw informal comparative inferences about two populations.
Ideal response and scoring
Parts (a) and (b):
Parts (a) and (b) ask students to use data on favorite type of cookie that has been summarized in two bar graphs (one for boys and one for girls) to answer questions about the distribution of responses for the entire class (both boys and girls). In part (a) students are asked to identify the most popular response for the class and it part (b) they are asked to identify the least popular response. In both parts, students are expected to provide a justification for their answer. Ideal responses to parts (a) and (b) identify the correct type of cookie and provide an appropriate justification.
In part (a), an ideal response would identify Thin Mints as the most popular choice for the class and would provide a justification based on the sum of the frequencies for this response from the given bar graphs ( 5 boys + 8 girls). The ideal response also notes that this frequency of 13 is greater than the class frequencies for either of the other two types of cookies.
In part (b), an ideal response would identify Samoas as the least popular choice for the class and would provide a justification based on the sum of the frequencies for this response from the given bar graphs (5 boys + 2 girls). The ideal response also notes that this frequency of 7 is less than the class frequencies for either of the other two types of cookies.
In each of parts (a) and (b), responses that selected the correct cookie type but then provided a weak justification or no justification are considered only partially correct. Responses that did not combine the responses for boys and girls to give an answer based on frequencies for the entire class but which provided two separate answers—one for boys and one for girls—are also considered to be only partially correct.
Part (c):
Part (c) asks students whether the girls or the boys were more consistent in the way they responded to the question about favorite type of cookie. An ideal answer to part (c) indicates that girls were more consistent in their responses and provides a justification that demonstrates an understanding of variability in categorical data.
Responses that provide a justification based on noting that the majority of girls picked a single cookie type and that there were not many responses in the other two categories and then making a comparison to the distribution of choices made by boys are essentially correct for part (c). If the justification provided describes the distribution for girls and notes that there was a clear preference for one type of cookies but does not compare to the distribution of choices for boys, the response to part (c) is considered to be partially correct. Responses that indicate that boys are more consistent in their choices are incorrect for part (c).
Sample responses indicating solid understanding
The following two student responses show a good understanding of the concepts assessed by this question and both received a score of 4.
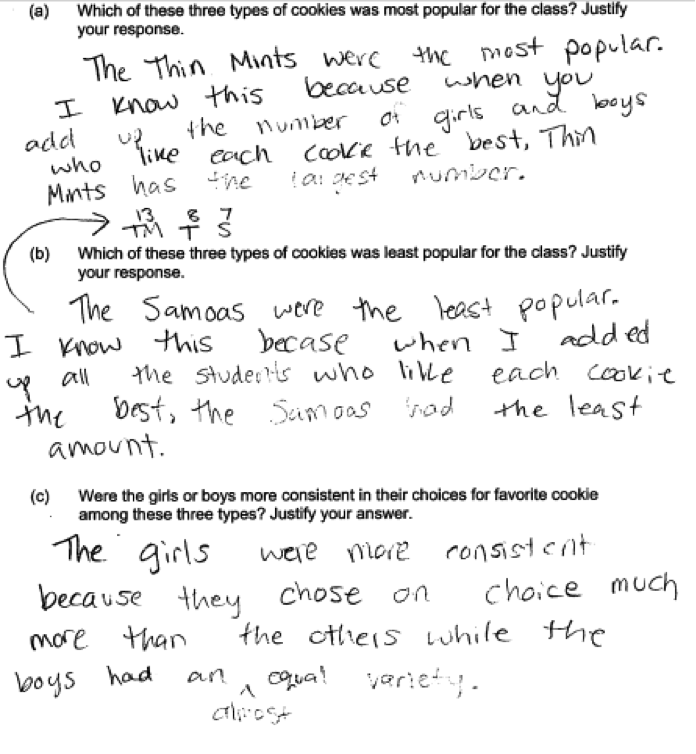
In the first student response below, the student identifies Thin Mints as the most popular cookie type in part (a) and Samoas as the least popular cookie type in part (b). These answers are justified by referring to correct class frequencies that are shown at the end of the response to part (a). Both parts (a) and (b) were scored as essentially correct. In part (c) the student correctly identifies girls as having the most consistent choice for favorite cookie based on having a clear preference for one type of cookie. The student also compares this to the distribution of cookie choices for boys, saying “while the boys had an almost equal variety.” Part (c) was scored as essentially correct, and with all four parts essentially correct, this student response received a score of 4.
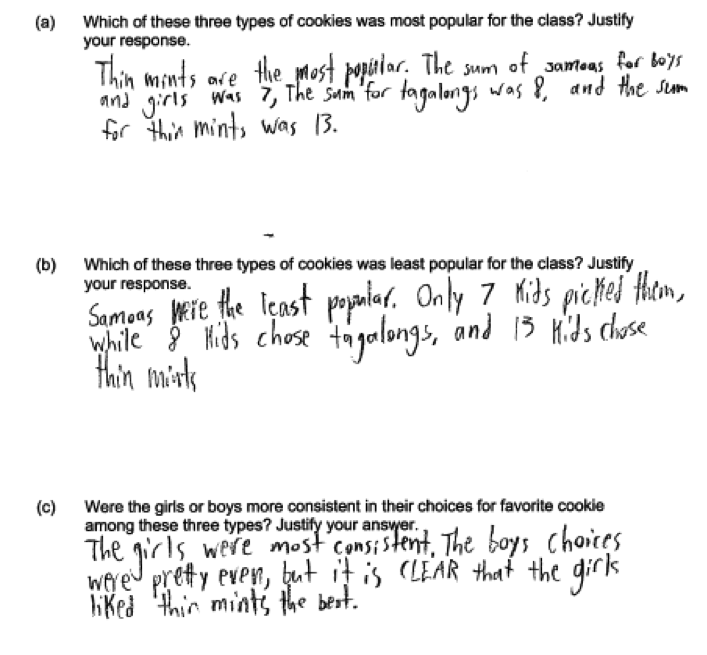
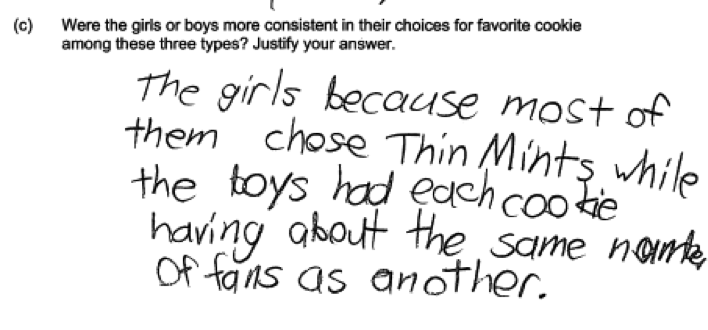
In the second student response below, parts (a) and (b) were scored as essentially correct. Part (c) was also scored as essentially correct because the justification indicates that the boys choices were “pretty even” (meaning that they choose each of the three types about the same number of times) but that girls had a clear preference for Thin Mints. This student response also received a score of 4.
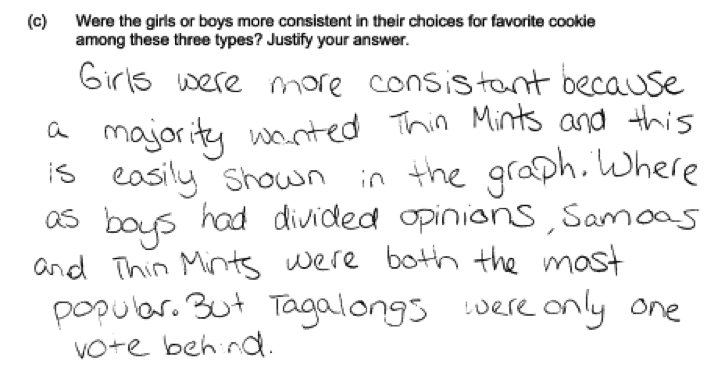
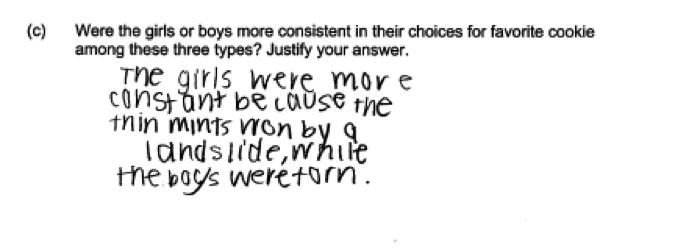
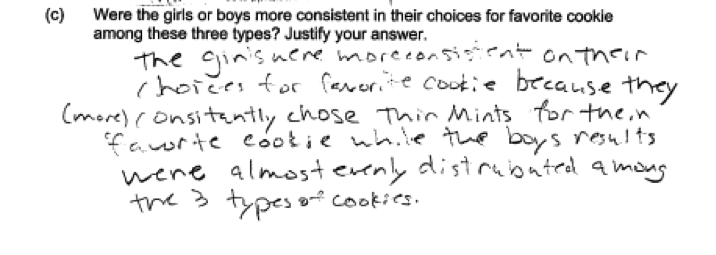
 There were a number of different ways to word the justification in a response to part (c). As long as the response indicated that girls were more consistent in their choices and the justification compared the choices made by girls and the choices made by boys in a way that conveyed an understanding of variability in categorical data, the response to part (c) was scored as essentially correct. This is illustrated in the following four responses to part (c).
Common misunderstandings
Parts (a) and (b) Use categorical data that have been summarized in a bar graph to answer questions about the data distribution of a categorical variable
Most students provided correct responses to parts (a) and (b) of this question. Responses that were not scored as essentially correct generally made one of three common mistakes.
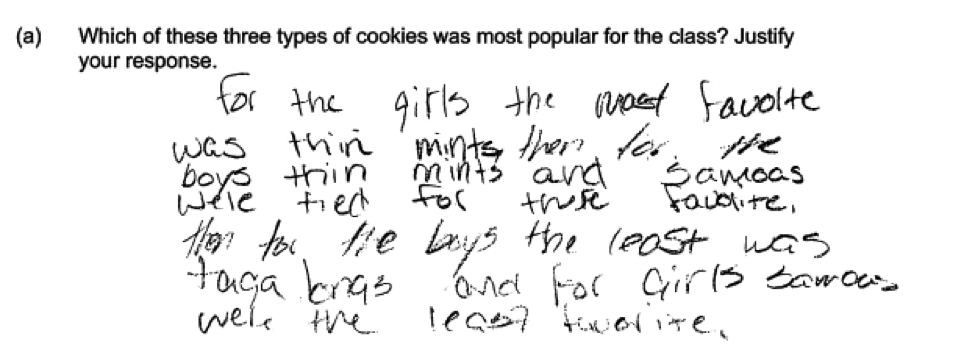
Some students did not combine the choices made by girls and the choices made by boys in order to determine the most popular and least popular choices for the class as a whole. Often these students provided separate assessments for boys and for girls or only addressed one gender in their response. For example, consider the following three student responses. Each of these responses describes the most or least popular for girls and for boys, but does not combine the given information to make a statement about the class. These responses were scored as partially correct for parts (a) or (b).
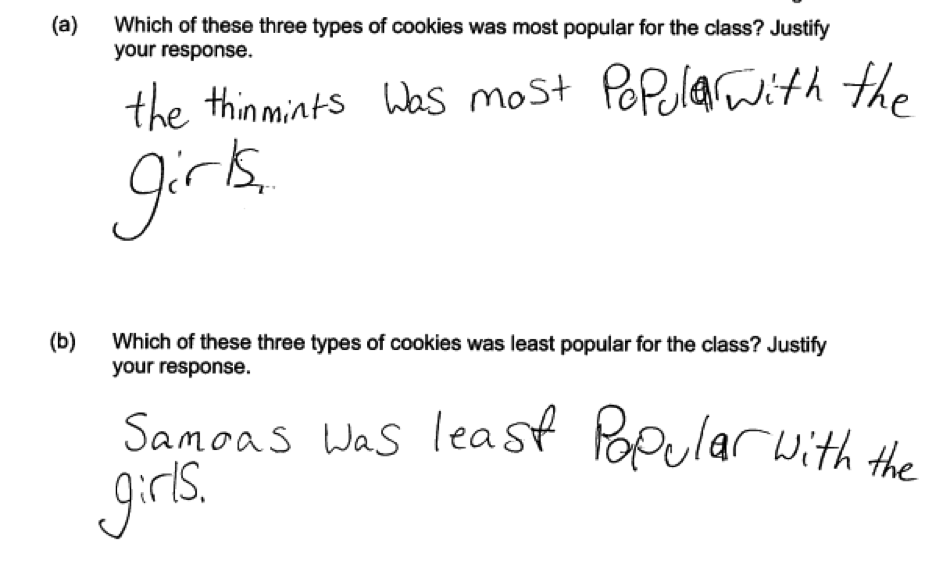
 The student response below is representative of those that did not answer the question in terms of the class and also did not address both genders in the response. This student response only answers the question for girls and also does not provided the requested justification. This student response was scored as incorrect for both parts (a) and (b).
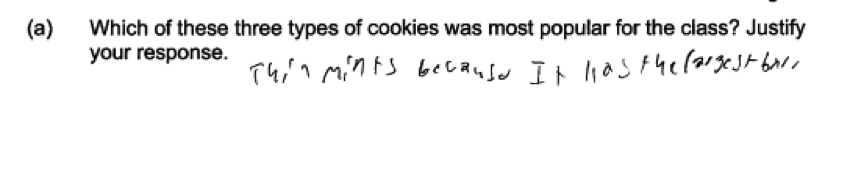
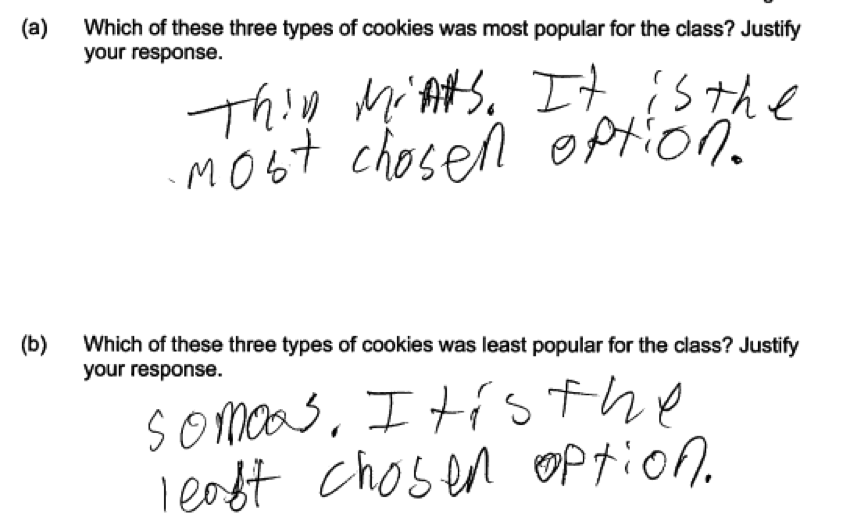
 Other students provided a justification that was judged to be weak or that did not make it clear that the answer was about the entire class. For example, the following two student responses were scored as only partially correct. In the first response (part (a)), the justification for Thin Mints in part (a) is “Thin mints because it has the largest bar.” In this response, it is not clear that the choices for girls and the choices for boys were combined. In the second student response (parts (a) and (b)), the justifications only states that the selected cookie type was “the most chosen option” or “the least chosen option.” As with the first response, there is not a clear indication that the counts for the girls and the counts for the boys were combined.
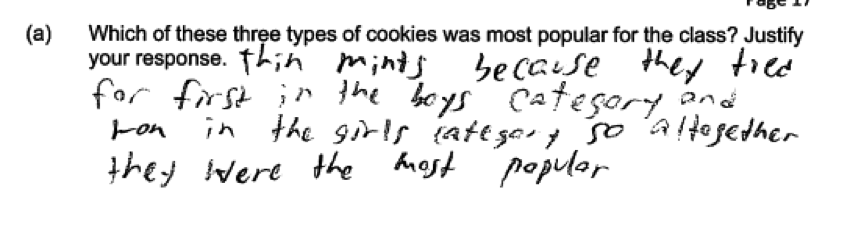
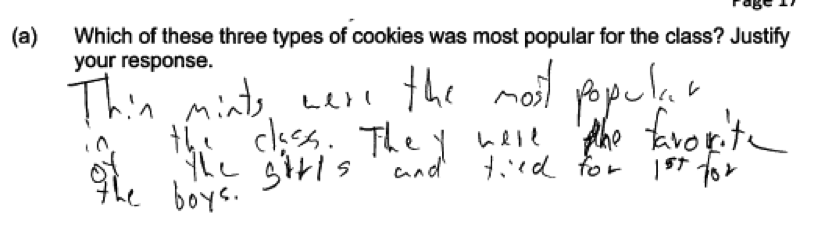
 To be considered essentially correct for either part (a) or part (b), the justification needs to make it clear that the counts for girls and the counts for boys were combined in order to reach an answer based on data for the entire class. This was sometimes a difficult call to make when scoring this question. For example, consider the following two responses to part (a) that are quite similar. The first was scored as essentially correct for part (a) because of the last part of the answer: “so altogether they were the most popular.” The second was scored as only partially correct, because it does not make it clear that information from the girls and from the boys was combined in order to reach an answer.
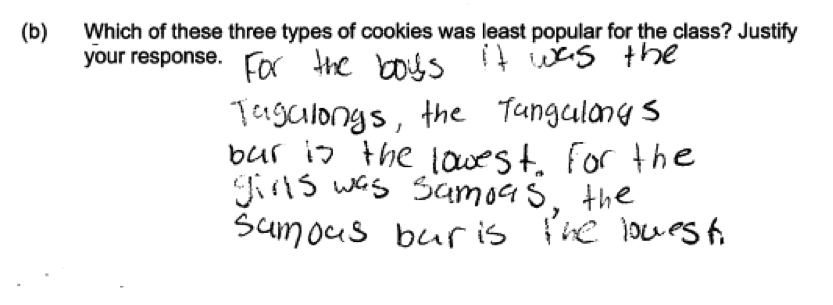
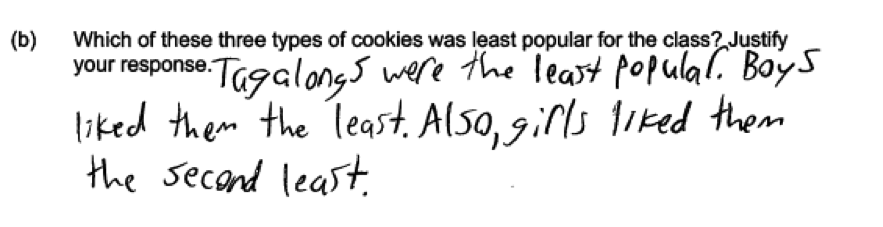
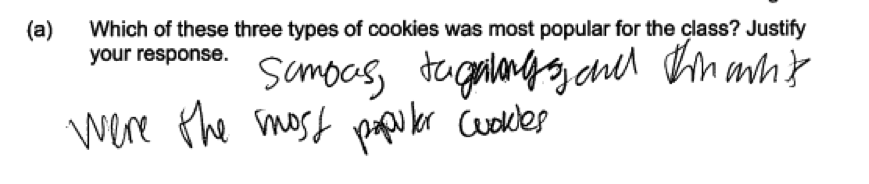
 Finally, some students were not able to use the information provided to make a correct determination of the most and least popular types of cookies for the class. For example, consider the following three student responses below. In the first response, which is a response to part (a), the student is not able to determine which type of cookie is most popular and indicates that all three types were the most popular. The second and third responses below are responses to part (b) and both responses incorrectly identify Tagalongs as the least popular type of cookie.


Part (c) Recognize and describe variability in the distribution of a categorical variable
Many students struggled with part (c) of this question and clearly had difficulty in thinking about the concept of variability in the context of categorical data. Many student responses received a score of incorrect for part (c).
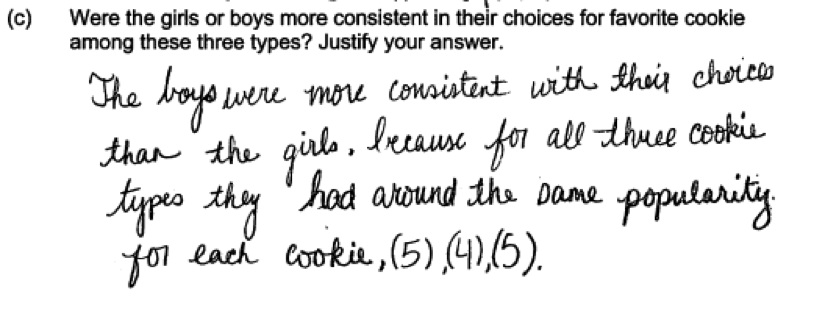
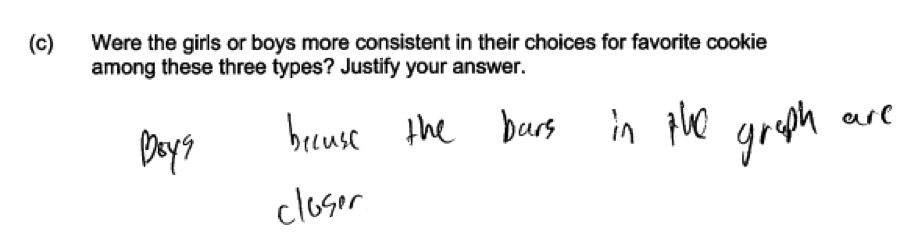
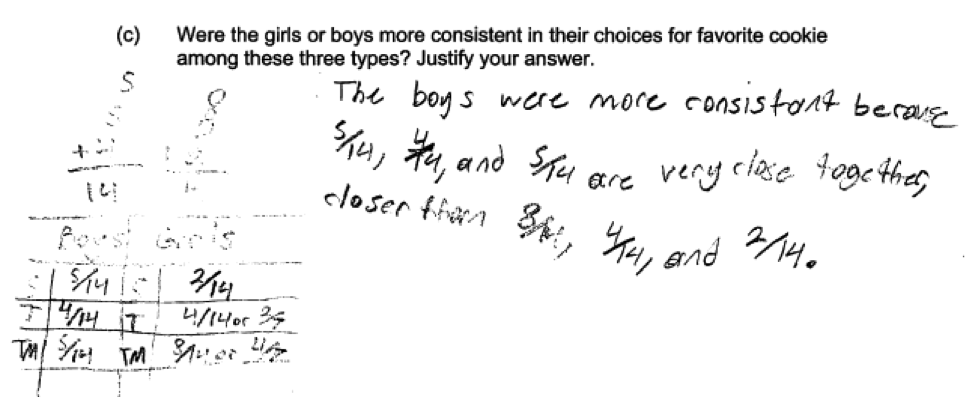
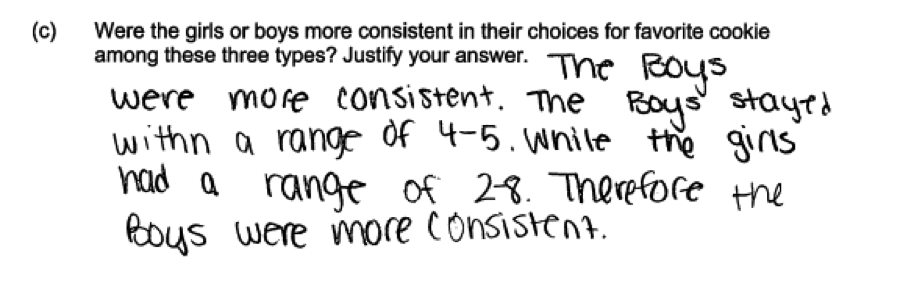
By far the most common error was for the student to interpret the frequencies (heights of the bars) as if they were numerical data values and to try to describe variability in the frequencies rather than variability in the actual data. This represents a conceptual error in thinking about the underlying data, which is categorical. This is illustrated in the following five student responses. Each of these responses make it clear that the student is looking at the category counts and think that the responses for boys are more consistent because the counts for the three different cookie types are quite similar. But for categorical data, this is actually an indication of variability in the data. For a data on a categorical variable, the least amount of variability possible occurs when all of the responses are in the same category.
 A different type of student error when responding to part (c) is illustrated by the following student response. In this response the student interpreted the question as one that asked for a comparison of the response distributions for boys and girls. This response was scored as incorrect for part (c) because it does not address variability in the data.
 Some students made correct observations about the choices made by girls and the choices made by boys, but never answered the question about whether boys or girls were more consistent in their choices. This is illustrated by the following student response.
 There were also a number of student responses that were scored as only partially correct because the justification provided was incomplete. For example, the following student response was scored as partially correct because the justification provided does not include any reference to the boys.
Resources
More information about the topics assessed in this question can be found in the following resources.
Free Resources
Guidelines for Assessment and Instruction in Statistics Education (GAISE)
Published by the American Statistical Association and available online, this document contains an example that poses and answers questions that are very similar to the parts of this Locus question. This example is titled “Level A revisited: Choosing a Band for the School Dance” (pages 38 – 40).
Resources from the National Council of Teachers of Mathematics
The NCTM publication Developing Essential Understanding of Statistics in Grades 6 – 8 includes a section on variability in categorical data on pages 18 – 19. This discussion is particularly relevant to part (c) of this Locus question and speaks to a common student misconception in working with categorical data.