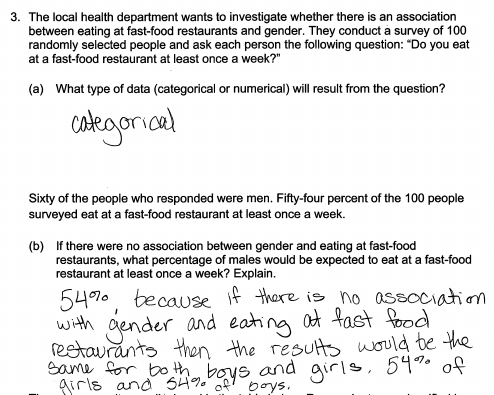
The local health department wants to investigate whether there is an association between eating at fast-food restaurants and gender. They conduct a survey of 100 randomly selected people and ask each person the following question: “Do you eat at a fast-food restaurant at least once a week?”
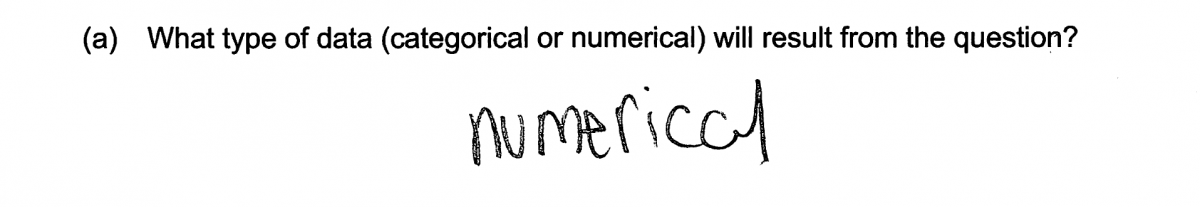
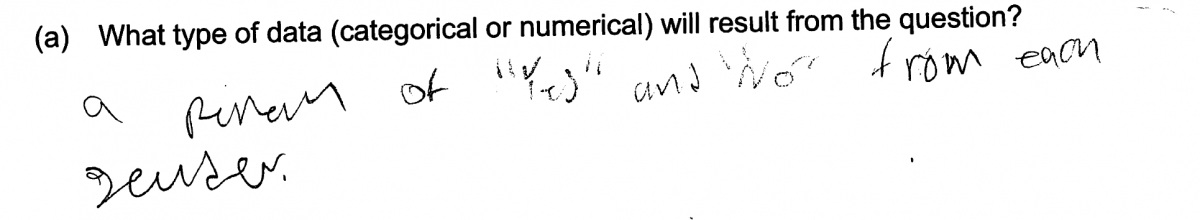
(a) What type of data (categorical or numerical) will result from the question?
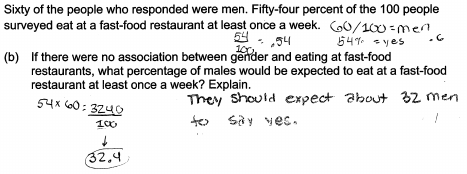
Sixty of the people who responded were men. Fifty-four percent of the 100 people surveyed eat at a fast-food restaurant at least once a week.
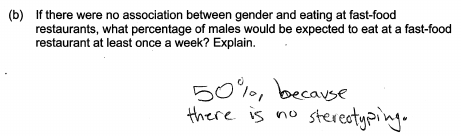
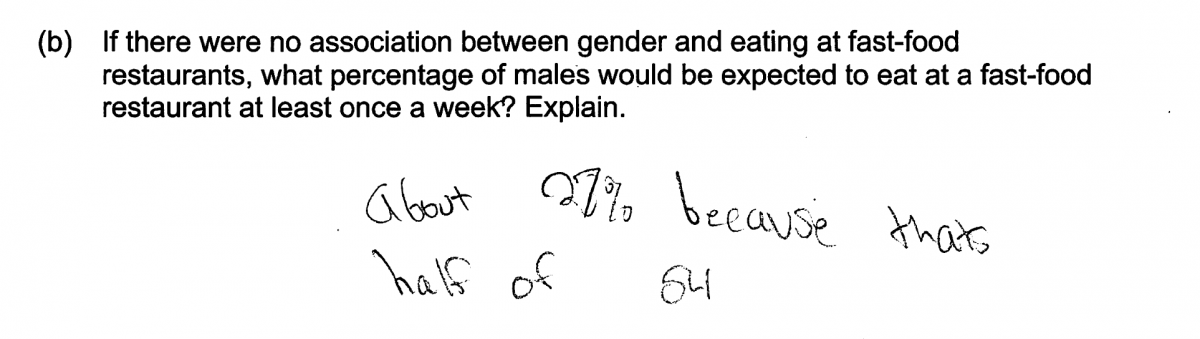
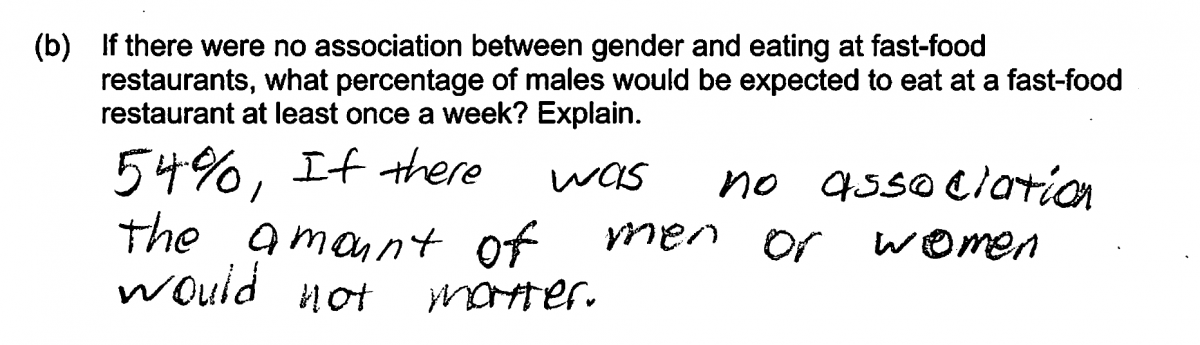
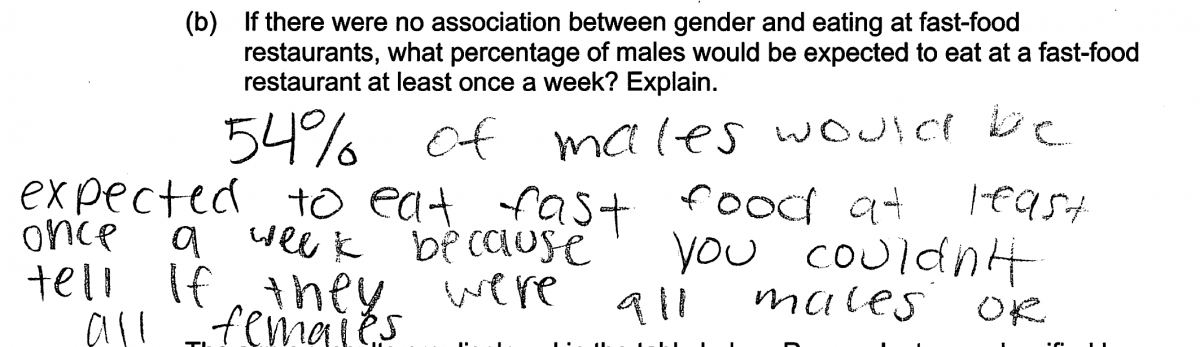
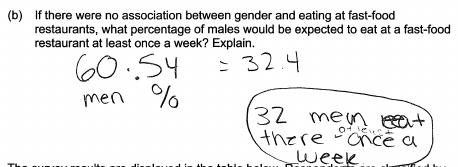
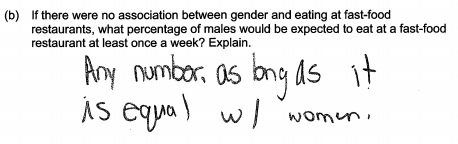
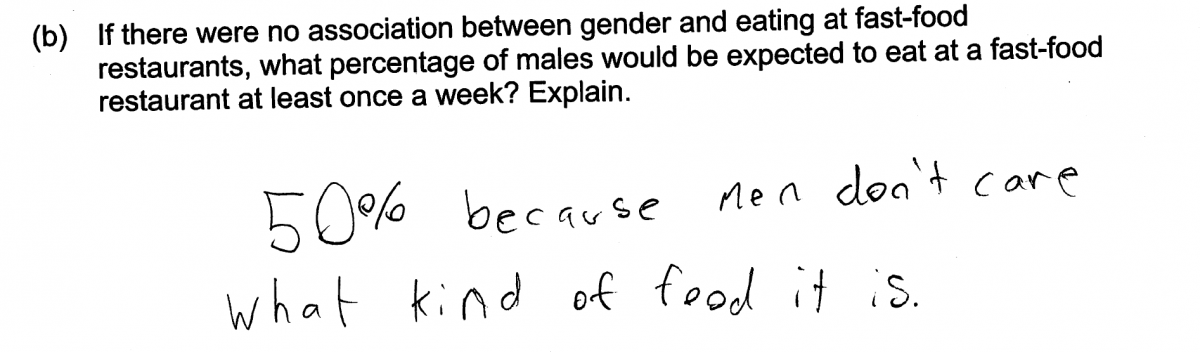
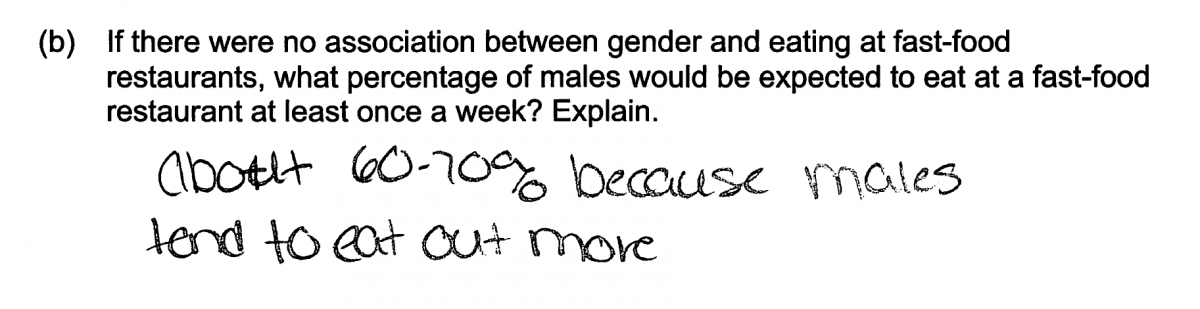
(b) If there were no association between gender and eating at fast-food restaurants, what percentage of males would be expected to eat at a fast-food restaurant at least once a week? Explain.
The survey results are displayed in the table below. Respondents are classified by gender (male or female) and whether or not they eat at a fast-food restaurant at least once a week.
Eat at a Fast-Food Restaurant at Least Once a Week
| Gender | Yes | No | Total |
| Male | 40 | 20 | 60 |
| Female | 14 | 26 | 40 |
| Total | 54 | 46 | 100 |
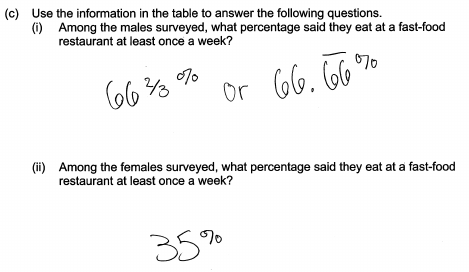
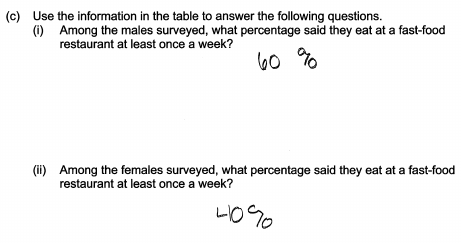
(c) Use the information in the table to answer the following questions.
(i) Among the males surveyed, what percentage said they eat at a fast-food restaurant at least once a week?
(ii) Among the females surveyed, what percentage said they eat at a fast-food restaurant at least once a week?
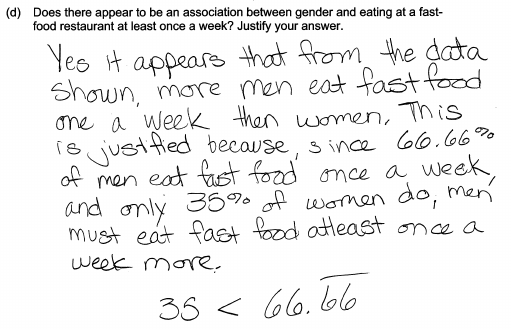
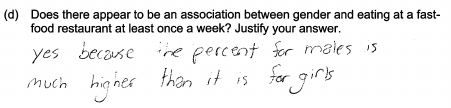
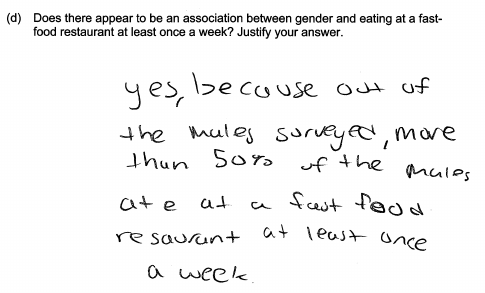
(d) Does there appear to be an association between gender and eating at a fast-food restaurant at least once a week? Justify your answer.
Overview of the question
This question is designed to assess the student’s ability to:
1. Identify what type of data (categorical or numerical) will result from a survey question (Part (a)).
2. Identify the value of a row relative frequency that would be consistent with no association (Part (b)).
3. Calculate row relative frequencies for a given two-way table (Part (c)).
4. Determine if there is evidence of association between two categorical variables (Part (d)).
Standards
8.SP.4: Understand that patterns of association can also be seen in bivariate categorical data by displaying frequencies and relative frequencies in a two-way table. Construct and interpret a two-way table summarizing data on two categorical variables collected from the same subjects. Use relative frequencies calculated for rows or columns to describe possible association between the two variables.
Ideal response and scoring
Part (a):
An ideal response to part (a) indicates that the data are categorical because the response belongs to one of two categories, Yes or No. Responses that list the possible categories of “Yes” and “No” but which do not specifically indicate that this is categorical data are considered to be partially correct for part (a).
Part (b):
An ideal response to part (b) indicates that if there is no association between gender and the response to the fast food question, then the percentage of males who eat fast food at least once a week should be the same as the percentage for the entire surveyed group, which was 54%. Responses that refer to 54% with only a weak explanation or no explanation, are considered partially correct for part (b). Also considered to be only partially correct for part (b) are responses that provide a reasonable explanation with no reference to 54% or that calculate an expected number of males who would eat fast food at least once a week if there were no association (60(0.54)=32.4).
Parts (c) and (d):
Parts (c) and (d) are combined for the purposes of scoring the response. An ideal response to parts (c) and (d) uses correct row relative frequencies to determine the percentage of males who reported eating fast food at least once a week (66.7%) and the percentage of women who reported eating fast food at least once a week (35%). The ideal response would then note that these row relative frequencies suggest that there is an association between gender and response to the fast food question and would provide a justification that was based on the row relative frequencies or percentage. This could be done by comparing the row relative percentages to the overall percentage of 54% and noting the differences or by comparing the row relative frequencies to each other and noting that if there were no association these relative frequencies should be equal (or approximately equal). Responses that include correct calculation and an appropriate justification were scored as essentially correct.
Responses that include correct calculations in part (c) but did not provided an adequate justification in part (d) are considered partially correct for the combined parts (c) and (d). Also considered to be partially correct are responses with incorrect calculations in part (c) but which provided a correct conclusion and justification in part (d) based on the percentages obtained in part (c).
Sample responses indicating solid understanding
This question was designed to assess students’ understanding of the concept of association between two categorical variables. The ultimate goal of this question is for students to determine if there is evidence of association between two categorical variables. Parts (b) and (c) were included primarily to help students answer part (d). While an appropriate justification in part (d) could be based on comparing the percentages calculated in part (c) to the overall group percentage of 54% from part (b), few students chose this option. Instead, most high-scoring responses directly compared the percentages from part (c) to each other appropriately.
The following response shows good understanding of the concepts assessed by this question and received a score of 4. The type of data is correctly identified in part (a). In part (b), 54% is correctly identified with a good explanation that indicates that if there is no association, the percentages for males and for females should both be the same as the overall group percentage of 54%. In part (c) the correct percentages are calculated even though no work is shown. In part (d), a correct conclusion about association is made and a justification that appropriately compares the percentages calculated in part (c) is provided.
Common misunderstandings
Part (a)
Identify what type of data (categorical or numerical) will result from a survey question.
Some students were not able to distinguish between categorical data and numerical data and indicated that the responses to the fast food question would be numerical. This was the most common error in answering part (a). The following student response is typical of those given by students making this error.
 Other students did not understand the question or did read the question clearly and responded by indicating the two possible response categories (yes, no) rather than the data type of categorical or numerical. This error is illustrated in the following student response.
Part (b)
Identify the value of a row relative frequency that would be consistent with no association.
In part (b), a common misconception was that no association exists between gender and eating fast-food at least once per week only when the response percentages are 50% for each possible response category. Students making this error focused on dividing the responses up evenly among the possible response categories. The following two student responses are typical of those that made this error. Both of these responses were scored as incorrect for part (b).

Because the context for this problem results in two possible categories for each variable (Male/Female and Yes/No), the specific source of students’ misconception about 50% is unclear: is the 50% because of the two gender categories or the two fast-food categories? Had the context allowed for more than two response categories for the fast food question (such as “Always,” “Sometimes,” “Seldom,” or “Never”) then it would be easier to identify the cause of confusion based on whether the student responded with 25% or 50%.
Some students believed that the 54% who reported eating fast food at least once per week would need to be divided evenly between males and females if there was no association, overlooking the important fact that there were more males than females in the group surveyed. This incorrect reasoning is illustrated by the following student response which was scored as incorrect for part (b).
Some student responses correctly indicated that the percentage would be 54%, but provided an explanation that was judged to be weak or incomplete. The two student responses that follow were both scored as only partially correct for this reason.
Many responses to part (b), such as the two below, focused on the expected count for males rather than the percentage. While responses like these show some understanding of the concept of independence between two categorical variables, they do not directly answer the question asked and so were scored as only partially correct for part (b).
Another error made by students in answering part (b) is illustrated by the following response. This student also indicates some understanding of the concept of independence, but does not make use of the information provided in the stem of the question and makes no reference to 54%. This response was considered partially correct for part (b).
 Finally, some students did not base their answers to part (b) on the given information and responded based on personal opinion. This is illustrated in the following two student responses, each of which was scored as incorrect for part (b).
Part (c)
Calculate row relative frequencies for a given two-way table.
In part (c), many students gave the (correct) joint percentages rather than the row relative percentages needed for assessing association. The student response below is typical of those making this error.

Another common error made by students was reporting the marginal percentages of males and females surveyed rather than the row relative percentages, as illustrated by the response below.
Part (d)
Determine if there is evidence of association between two categorical variables.
In part (d), many responses indicated that there is an association between gender and eating at a fast-food restaurant at least once a week but had justifications that were considered too weak to be marked as essentially correct. For example, in the response below, the justification omits the correctly calculated percentages and makes an implicit argument. Because there was no explicit comparison of the percentages, this response was scored as partially correct for the combined parts (c) and (d).
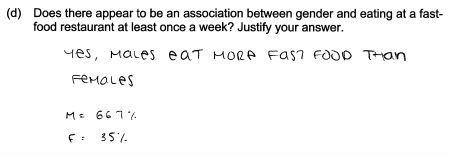
In the response below, the justification is that “males eat more fast food than females” which is not exactly what is being measured, i.e. this response focuses on the amount of fast food eaten rather than the categorical response to the question about whether fast food is eaten at least once per week. While this or a similar answer would be scored as essentially correct if an explicit, appropriate comparison of percentages was made, simply listing the percentages together is not sufficient for a comparison.
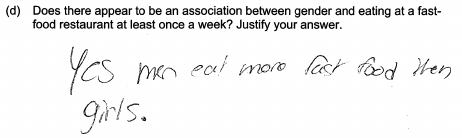
In part (d), instead of justifying their answer using parts (b) and (c), many students answered based on their personal experiences without appealing to any of the given or calculated information. While the phrasing in the student response below may be ambiguous enough to allow the reader to infer the correct meaning, without further clarification this response is not correct. There is a tendency for students inexperienced with statistics to reason based on their personal beliefs and experiences without regard to data; the response below is consistent with this reliance on personal beliefs.
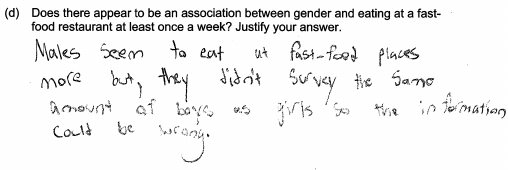
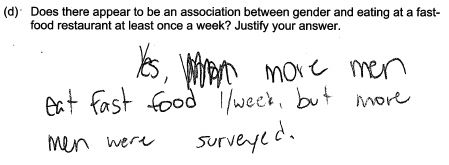
Other students focused on the different number of males and females surveyed and erroneously indicated that conclusions made when the sample sizes are different might be wrong (because of the sample size discrepancy). Two examples of this are given below.
Similar to a misconception that also surfaced in answers to part (b), some students compared the percentages to 50% rather than 54%. This illustrates the misconception that the responses must be split 50/50 if there is no association between gender and eating fast-food at least once per week. In fact, no association exists when the percentage of males eating fast food at least once per week and the percentage of females eating fast food at least once per week is the same as the percentage for the overall group, which in this case happens to be 54%. The response below indicates this misconception.
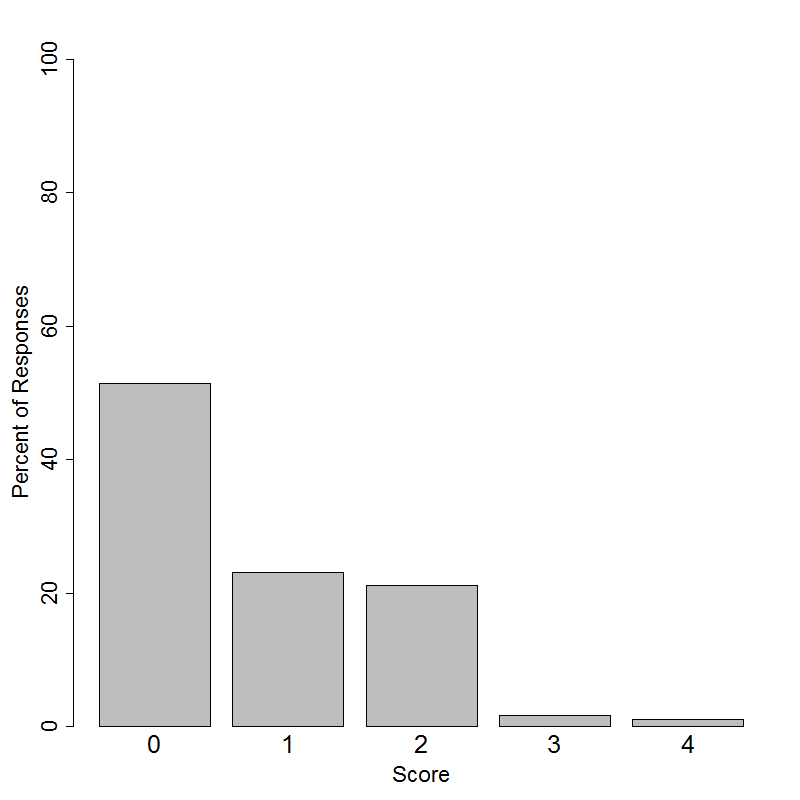
Student performance
Resources
More information about the content assessed in this question can be found in the following resources.
Free Resources
Lessons
Statistics Education on the Web (STEW) has peer reviewed lessons plans. Some lessons related to the topic of this question are:
You Will Soon Analyze Categorical Data (Classifying Fortune Cookie Fortunes)
The Case of the Careless Zookeeper
Applets
The Rossman/Chance Applet Collection has an applet for Analyzing Two-Way Tables using both the Chi-Squared test and a randomization-based approach. This applet is related to the content of this item but does so at a more advanced level.
Classroom and Assessment Tasks
Illustrative Mathematics has peer reviewed tasks that are indexed by Common Core Standard. Two tasks relevant to the concepts assessed in this Locus question are:
S-IC, S-ID Musical Preferences
Support for a Longer School Day?
Guidelines for Assessment and Instruction in Statistics Education (GAISE)
Published by the American statistical Association and available online, this document discusses the learning progression for students regarding the topics of categorical variables, two-way tables, and association through the Popular Music example at levels B (p.38-40 and p.95-98) and C. (p.71-75).
Resources from the American Statistical Association
Bridging the Gap Between Common Core State Standards and Teaching Statistics is a collection of investigations suitable for classroom use. This book covers association between two categorical variables in Investigation 4.4, “Can You Roll Your Tongue?” p.153-162. This investigation is available as the free sample lesson for the book.
Making Sense of Statistical Studies is a collection of investigations suitable for classroom use. Association between categorical variables in explored in Investigation 8 p.87-94, Investigation 12 p.138-144, and Investigation 15 p.166-181.
Resources from the National Council of Teachers of Mathematics
The NCTM publication Statistical Questions from the Classroom discusses association and independence on p.29-33.
The NCTM publication Developing Essential Understanding of Statistics in Grades 6 – 8 covers association between two categorical variables in Big Idea 3, p.52-56.
The NCTM publication Navigating through Data Analysis in Grades 9 – 12 covers making decisions with categorical data on p.29-41. Additionally, Problems 1 and 2 on p.79-85 cover association between two categorical variables.