To find out whether name-brand garbage bags hold more weight than generic-brand garbage bags, an eighth-grade class purchased 100 name-brand trash bags and 100 generic-brand garbage bags. They loaded each bag with baseballs until the bag broke. The number of baseballs put into each bag before the bag broke was recorded. The boxplots below were created using the recorded data.
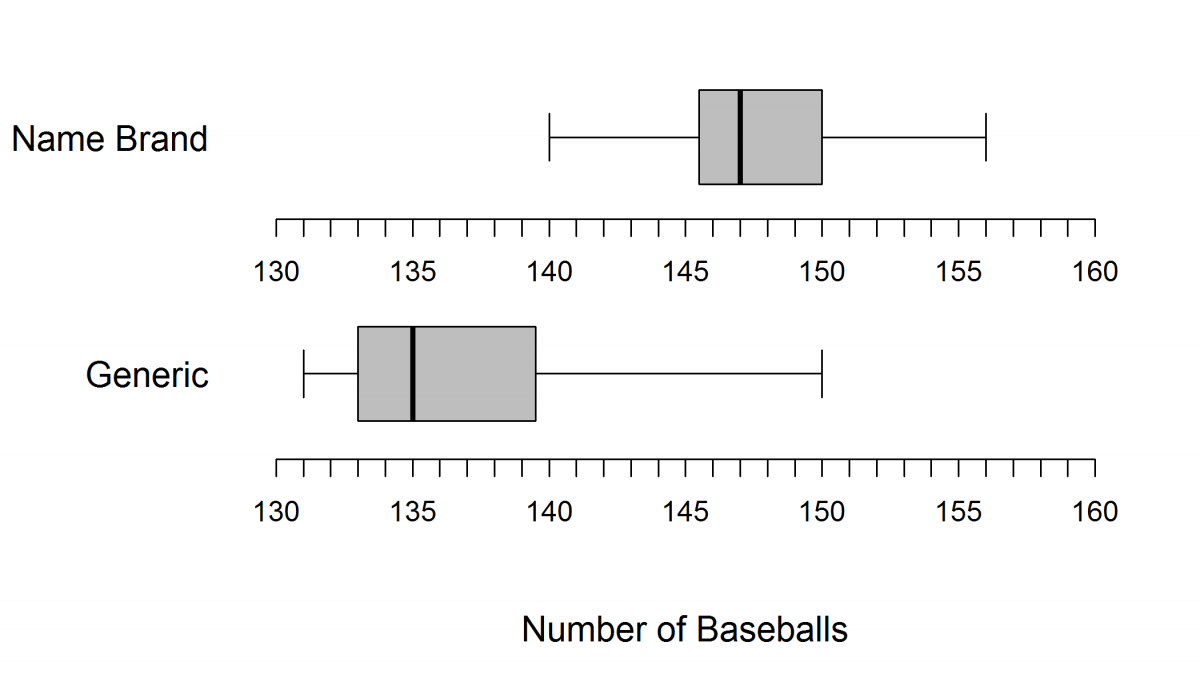
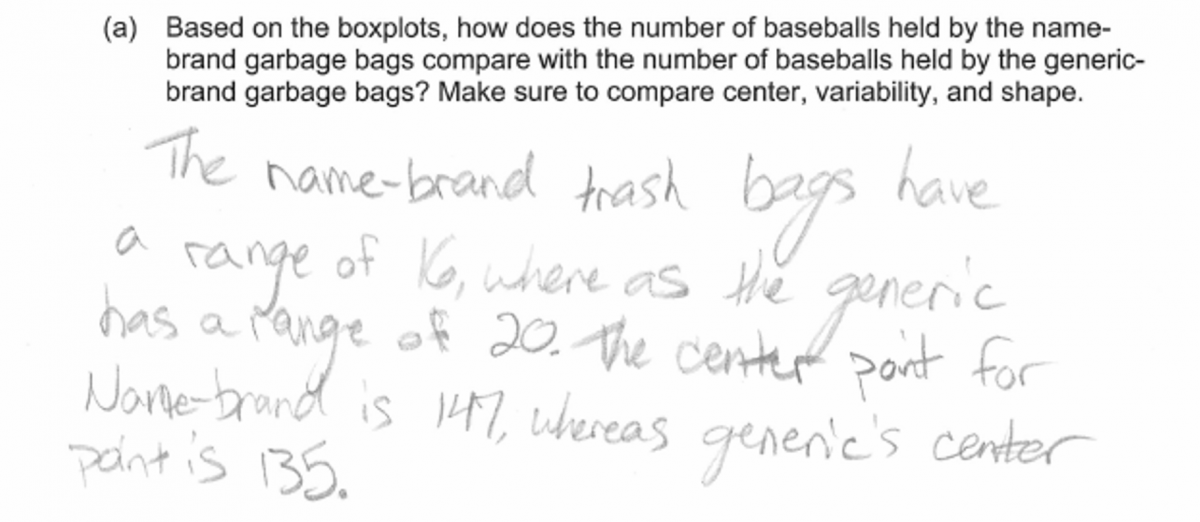
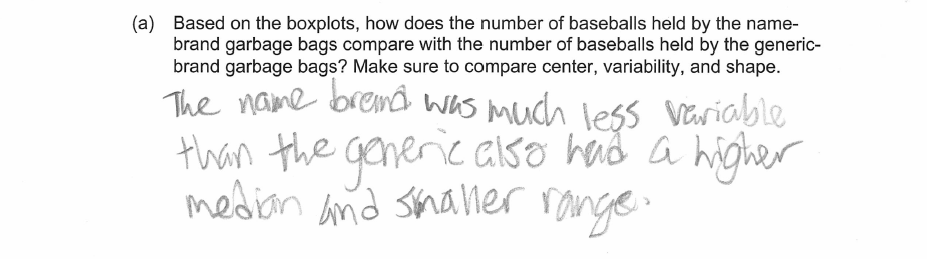
(a) Based on the boxplots, how does the number of baseballs held by the name-brand garbage bags compare with the number of baseballs held by the generic-brand garbage bags? Make sure to compare center, variability, and shape.
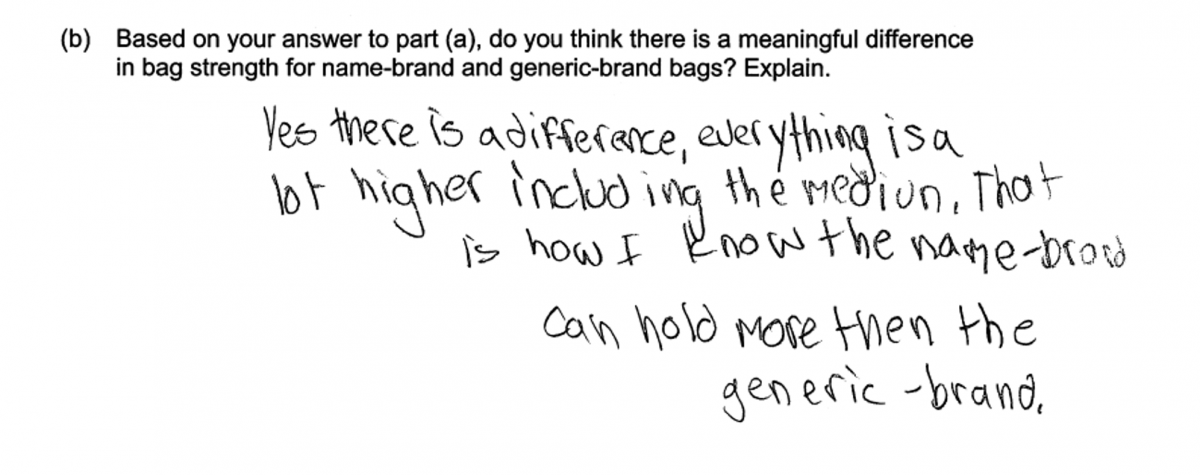
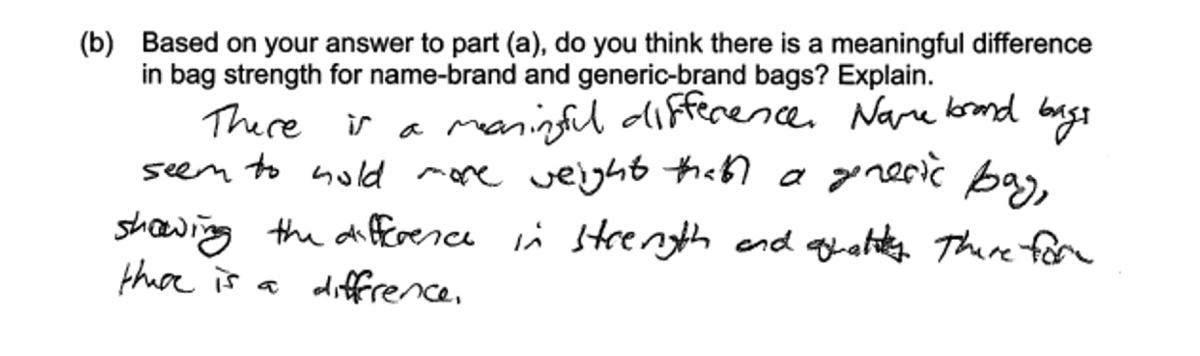
(b) Based on your answer to part (a), do you think there is a meaningful difference in bag strength for name-brand and generic-brand bags? Explain.
Overview of the question
This question is designed to assess the student’s ability to:
1. Use information from boxplots to compare two data distributions (part (a)).
2. Use boxplots to determine if there is a meaningful difference between two distributions (part (b)).
Standards
6.SP.4: Display numerical data in plots on a number line, including dot plots, histograms, and box plots.
7.SP.3: Informally assess the degree of visual overlap of two numerical data distributions with similar variabilities, measuring the difference between the centers by expressing it as a multiple of a measure of variability.
7.SP.4: Use measures of center and measures of variability for numerical data from random samples to draw informal comparative inferences about two populations.
Ideal response and scoring
Part (a):
Part (a) asks students to compare two brands of trash bags based on boxplots. An ideal response to part (a) is one that includes comparative statements for all three characteristics (centers, shapes, and amounts of variability) of the distributions with explicit reference to statistical summaries such as the medians, variability, range, or IQR in the comparisons of center and variability. Responses that only include comparative statements about only two of the characteristics are considered to be partially correct.
Responses that make statements about the boxplots that are not comparative in nature or do not include explicit references to statistical summaries from the boxplots are considered incorrect.
Part (b):
An ideal response to part (b) states that there is a meaningful difference between the two distributions and provides a statistical justification that mentions overlap and/or separation. Responses that recognize that the difference is meaningful but a statistical justification that does not address overlap or separation are considered to be partially correct for part (b). Also considered to be only partially correct were responses that provide a reasonable explanation based on overlap or separation but which do not explicitly answer the question about whether there is a meaningful difference.
Responses that simply states that there is a meaningful difference without providing a statistical justification are scored as incorrect for part (b).
Sample responses indicating solid understanding
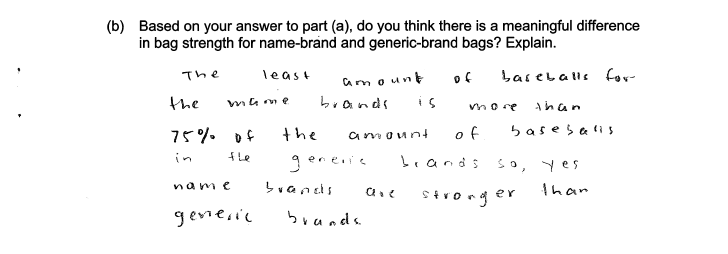
While some students demonstrated the ability to use boxplots to compare distributions, none of the students in the initial administration of this exam provided responses that correctly compared center, variability, AND shape. The following student response shows a fairly good understanding of the concepts assessed by this question and received a score of 3. In part (a), there are comparative statements for both center and a measure of variability (range), but there was no comparison of shape. Therefore, part (a) was scored as partially correct. In part (b), the student indicates that name brand garbage bags are stronger than generic bags. While they make a weak statement about separation in part (b), their last statement in part (a) is used as further support for their argument regarding separation of the boxplots, and part (b) was scored as essentially correct. With one part essentially correct and one part partially correct, this student response received a score of 3.
While most responses for part (a) compared the median and range of the two distributions, some responses made comparisons of variability by commenting on the interquartile range, as illustrated in the following student response.
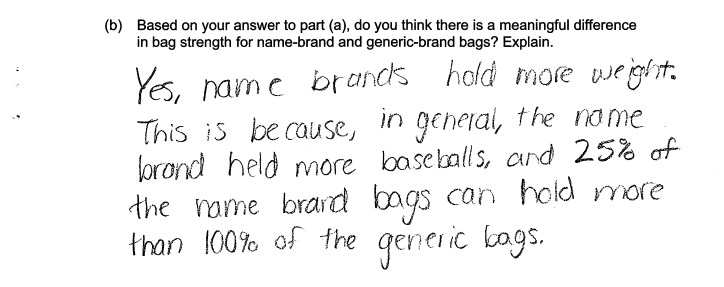
Responses for part (b) could be scored as essentially correct as long as they addressed either the overlap and/or separation of the two boxplots. Many students commented on the degree of separation between the two boxplots with statements that exemplify their knowledge of quartiles. This is illustrated by the following two student responses, which were also scored as essentially correct for part (b).
Common misunderstandings
Part (a): Use information from boxplots to compare two data distributions.
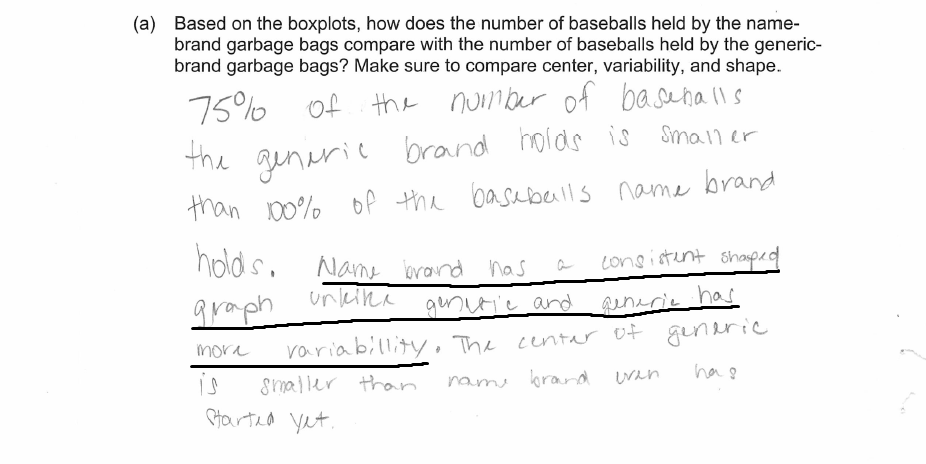
In general, many student responses exemplified a lack of vocabulary to adequately describe the boxplots, particularly when it came to describing distribution shape. For example, in the student response below the response says that “graph” for name-brand bags has a more “consistent” shape than the generic-brand boxplot rather than using terms more appropriate for describing the shape of a distribution such as symmetric and skewed.
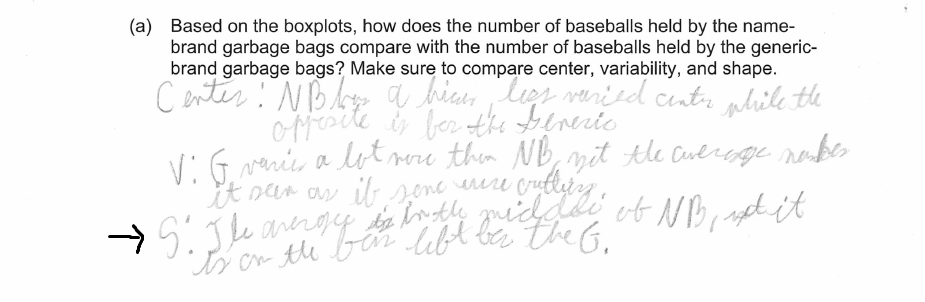
The following student response also struggles with the description of shape, stating that the “average is in the middle of” name brand, and it is “on the far left” for the generic brand. Again, this student appears to notice the location of the center with respect to other elements of the boxplot, which generally helps to describe the shape of the distribution. However, the student does not have the vocabulary to fully develop this comparison of shape.
Many students demonstrated an understanding of boxplots at a level where they could identify measures of center and spread. However, there were few responses that used these measures to make any sort of comparisons between the two distributions. When comparing distributions using boxplots, it is not only important to identify key statistical summaries from the plot, but also to make comparative statements using these numbers. For example, in the following student response, the student mentions both measures of center and measures of spread, but does not make comparative statements based on these measures.
Many students make correct statements regarding the variability of the two boxplots. The number of baseballs held by the name-brand garbage bags does appear to vary less than the number of baseballs held by the generic-brand bags. However, many students failed to make reference to the information provided in the boxplots (such as the ranges or the IQRs) to support their comparison of the variability. The following student response is typical of those making this error.
Part (b): Use boxplots to determine if there is a meaningful difference between two distributions.
The most common student error in responding to part (b) of this question was a failure to support the conclusion that there was a meaningful difference in the distribution with an explanation that was based on overlap or separation of the two distributions. For example, the student response below indicates that the median of the brand name distribution is greater than the median for the generic distribution. While true, this alone does not mean there is a meaningful difference between the two distributions. To assess whether the difference is meaningful, some reference to the overlap or separation of the boxplots is necessary.
Many students indicated that there was a meaningful difference but did not provide an explanation to support this conclusion. Responses like the one below were scored as incorrect for part (b).
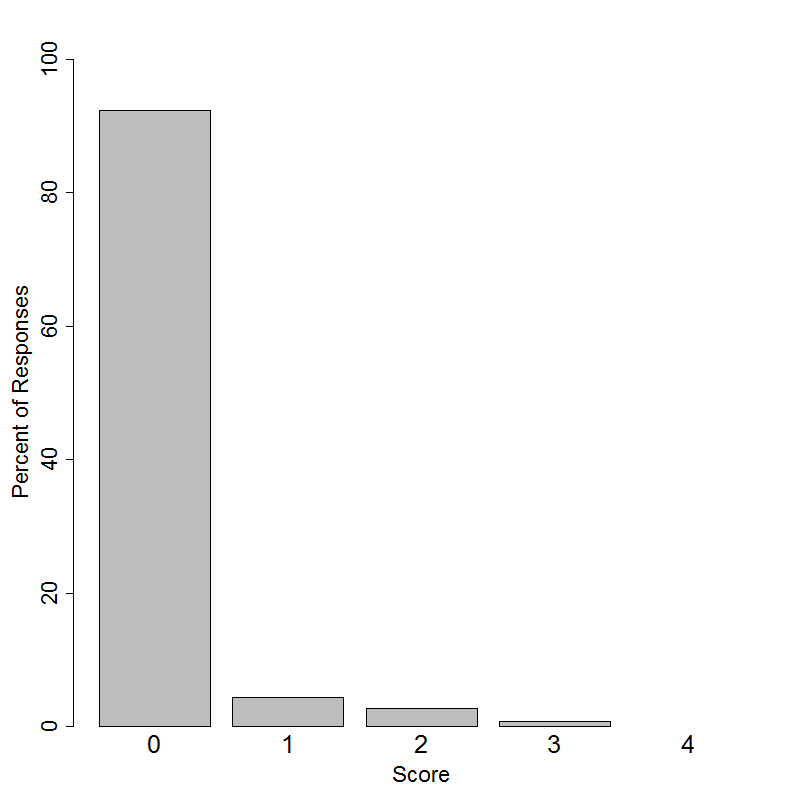
Student performance
Resources
More information about the topics assessed in this question can be found in the following resources.
Free Resources
Common Core Progressions Documents
A discussion of informal comparative inference and of the intent of Common Core standards 7.SP.3 and 7.SP.4 and how this content might be developed in the classroom can be found in Common Core Tools progressions document for statistics in grades 6 – 8. See the discussion on pages 9 - 10.
Lessons
Statistics Education on the Web (STEW) has peer reviewed lessons plans. Some lessons related to the topic of this question are:
Are Female Hurricanes Deadlier than Male Hurricanes?
Classroom and Assessment Tasks
Illustrative Mathematics has peer reviewed tasks that are indexed by Common Core Standard. A task that involves drawing informal inferences about the differences between two groups is Offensive Linemen. Although this task uses dot plots rather than box plots in the comparison, the reasoning involved is similar to what is needed to answer parts (b) and (c) of this LOCUS question.
Guidelines for Assessment and Instruction in Statistics Education (GAISE)
Published by the American Statistical Association and available online, this document contains a discussion on comparing distributions using boxplots on pages 46 – 48.
Resources from the American Statistical Association
Bridging the Gap Between Common Core State Standards and Teaching Statistics is a collection of investigations suitable for classroom use. This book contains an investigation that involves using boxplots to make an informal inference and assessing the degree of visual overlap (How Fast Can You Sort Cards?, pages 126 – 140). The Example of ‘Interpret the Results’ section (pages 135 – 137) illustrates the type of reasoning needed to answer part (b) of this LOCUS question.
Making Sense of Statistical Studies is a collection of investigations suitable for classroom use. Many of the investigations discuss the use of boxplots when comparing two or more distributions.
Resources from the National Council of Teachers of Mathematics
The NCTM publication Developing Essential Understanding of Statistics in Grades 6 – 8 includes a section on the big idea “Comparing Distributions.” See the discussion on pages 42 – 50.
The NCTM publication Navigating through Data Analysis in Grades 9 – 12 includes a chapter titled “Making Decisions with Numerical Data” that contains information about concepts assessed in this question.