Note: This particular item has several instructional components and was developed only to be used on the pilot form of the LOCUS Assessments.
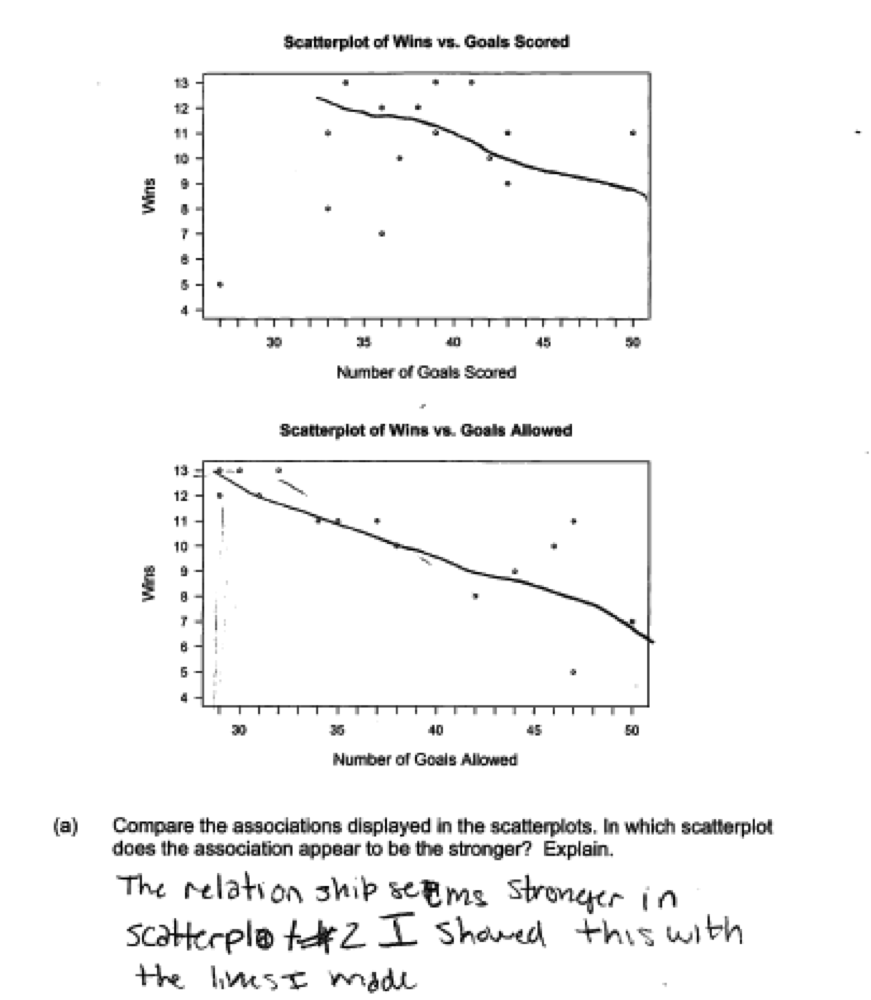
The scatterplots below show the number of wins plotted against the number of goals scored by a soccer team and the number of wins plotted against the number of goals allowed by a soccer team.
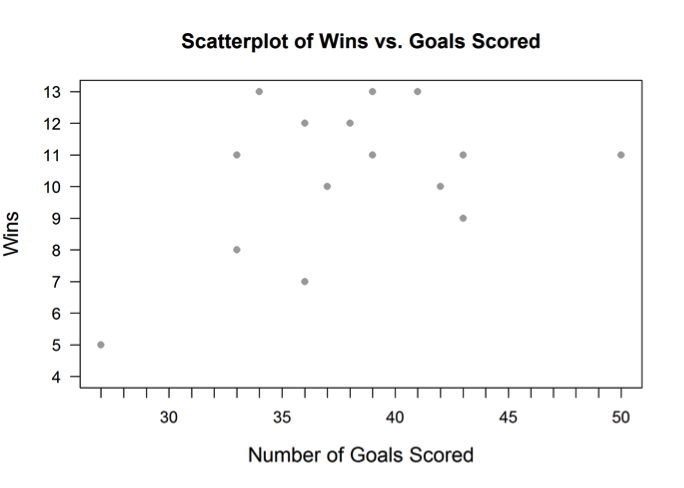

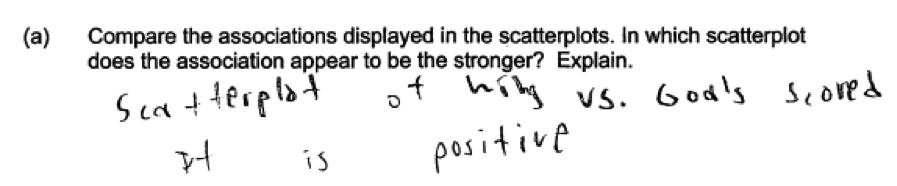
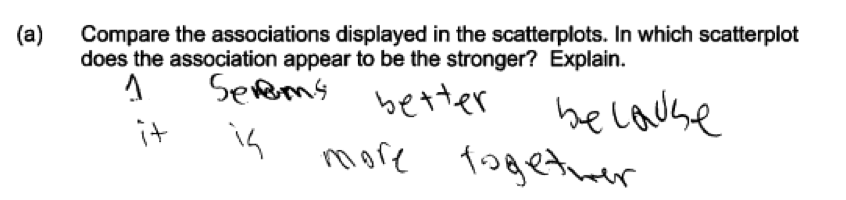
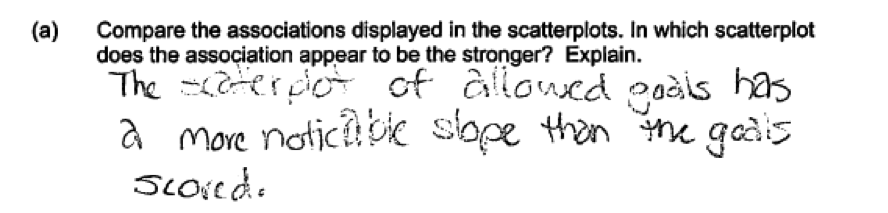
(a) Compare the associations displayed in the scatterplots. In which scatterplot does the association appear to be the stronger? Explain.
_______________________________________________________________________________________________________________________________________________________________________________________________________
This part of the question is intended for students that are unfamiliar with the QCR (quadrant count ratio). If you are familiar with the QCR, please proceed to the text just below this box.
One measure of the strength of an association is the QCR (quadrant count ratio). To calculate the QCR, divide the scatterplot into 4 quadrants by drawing a vertical line at the mean value for the explanatory variable (either Goals Scored or Goals Allowed), and by drawing a horizontal line a the mean value of the response variable (number of wins). Then, count the number of points in each quadrant and calculate:

For example, here is the scatterplot for the number of wins plotted against the number of goals scored by a team, along with a vertical line at the mean number of goals scored (38.1) and a horizontal line at the mean number of wins (10.8).
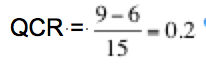
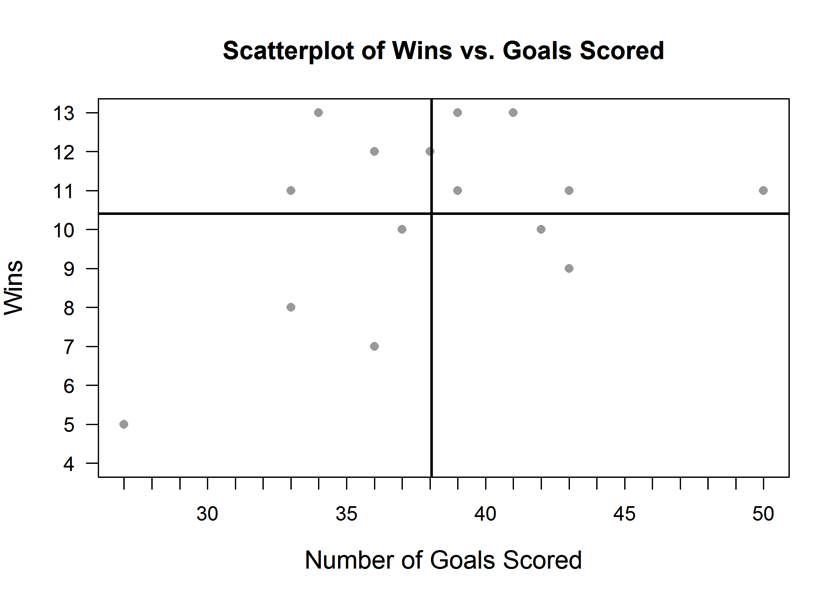 The QCR for the association between Wins and Goals Scored is:
A QCR close to +1 suggests a strong positive association. A positive QCR close to 0 suggests a weak positive association. A QCR close to -1 suggests a strong negative association. A negative QCR close to 0 suggests a weak negative association.
Thus, a QCR of 0.2 is a positive number, and suggests a weak positive association between wins and goals scored.
_______________________________________________________________________________________________________________________________________________________________________________________________________
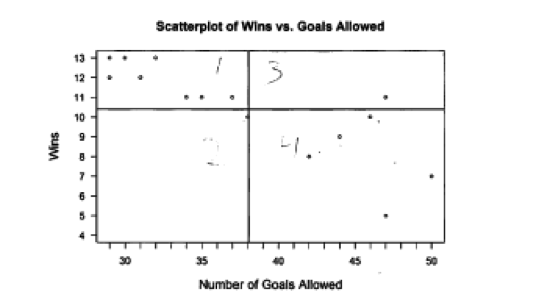
The scatterplot below shows the number of wins plotted against the number of goals allowed. The mean number of goals allowed is 38.1 and the mean number of wins is 10.4.
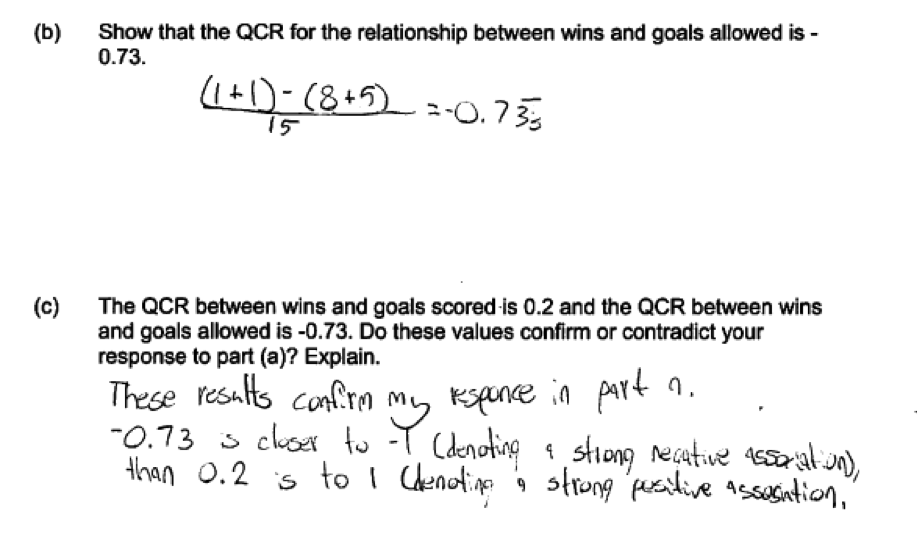
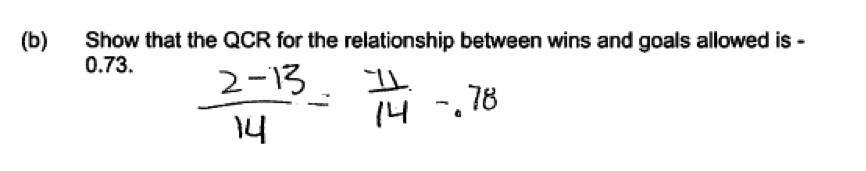
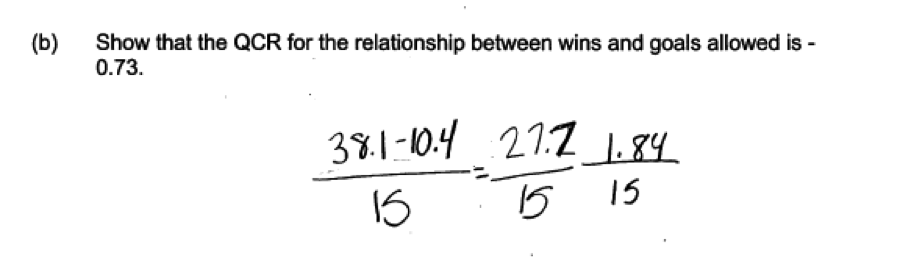
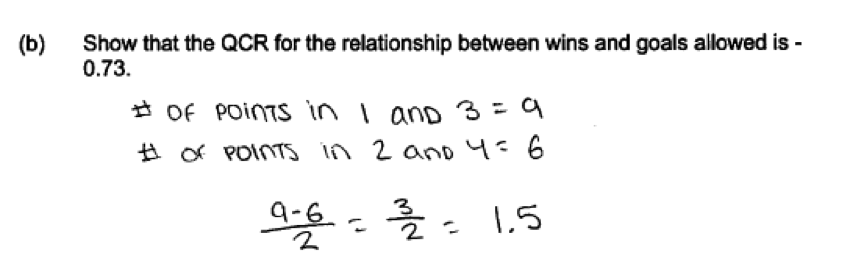
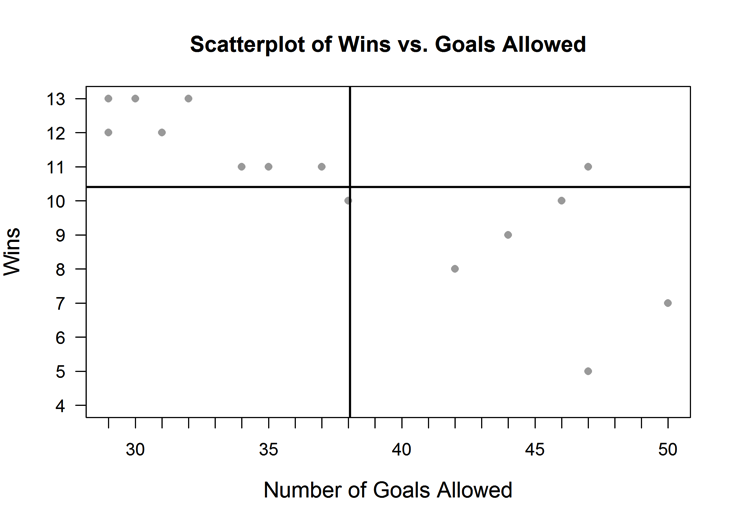 (b) Show that the QCR for the relationship between wins and goals allowed is -0.73.
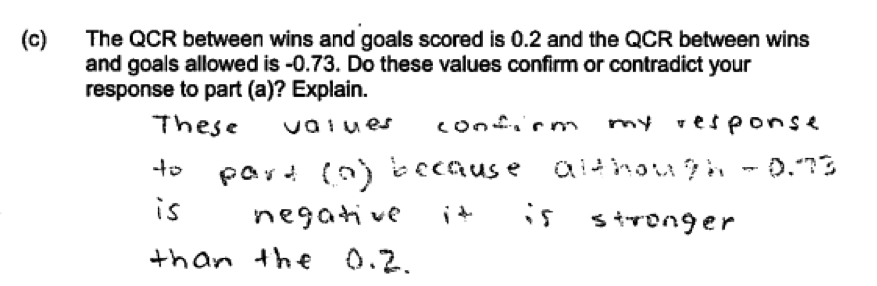
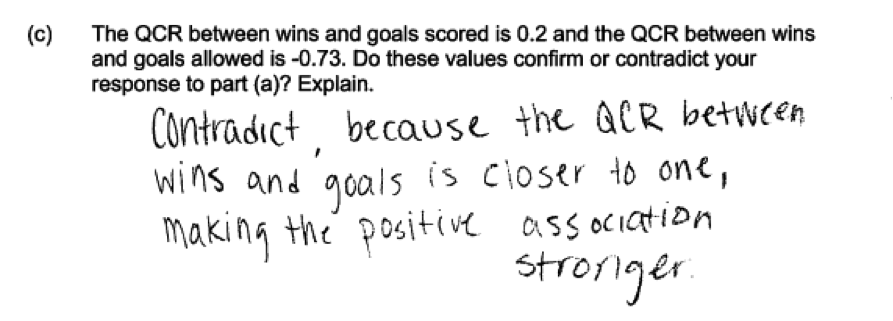
(c) The QCR between wins and goals scored is 0.2 and the QCR between wins and goals allowed is -0.73. Do these values confirm or contradict your response to part (a)? Explain.
Overview of the question
This question is designed to assess the student’s ability to:
1. Describe and compare associations when data are represented in a scatterplot (part (a)).
2. Calculate a Quadrant Count Ratio, QCR (part (b))
3. Assess strength of association using the QCR (part (c)).
Standards
Although QCR is not specifically identified in the Common Core State Standards, it serves as an excellent introduction to the concept of association.
8.SP.1: Construct and interpret scatter plots for bivariate measurement data to investigate patterns of association between two quantities. Describe patterns such as clustering, outliers, positive or negative
association, linear association, and nonlinear association.
Ideal response and scoring
Part (a):
Part (a) asks students to describe the strength of relationship between two numerical variables for data displayed in a scatterplot. In addition, students must consider two scatterplots and determine which scatterplot depicts a stronger association between the two variables used to create the scatterplot. An ideal response to part (a) recognizes that there is only a weak positive association between wins and number of goals scored (the first scatterplot) and that even though the association between wins and number of goals allowed is negative, the association in that scatterplot (the second scatterplot). To be considered essentially correct for part (a), a response must correctly comment on both the association between wins and goals scored and the association between wins and goals allowed. It must then also correctly compare the strength of the two associations and indicate that the association between wins and goals allowed is stronger than the association between wins and goals scored.
Responses the made a correct comparison, but which did not provide a clearly communicated description of the two associations to justify the choice are considered to be partially correct for part (a). Also considered as partially correct for part (a) are responses that give a good description of the two associations but either fail to actually indicate which association is stronger or make an incorrect choice.
Part (b):
The quadrant count ratio (QCR) is a conceptual measure of association between two numerical variables that is accessible to students at the middle school level. (See the Resources section of this document for information on where you can find more on the QCR.) In part (b) of this question, students are asked to compute the quadrant count ratio (QCR) based on a given scatterplot with quadrants indicated on the scatterplot. Because many students may not have encountered the QCR in their class work, instructions for calculating the QCR and an example are included.
An ideal response to part (b) includes a correct calculation of the QCR and shows supporting work with correct quadrant counts. A response that uses shows the correct quadrant counts but makes an error in the actual calculation of the QCR is considered partially correct for part (b).
Part (c):
In part (c), students are given the values of the QCR for wins and goals scores and for wins and goals allowed. They are then asked to explain how these values either confirm or contradict the response given in part (a). An ideal response to part (c) makes a correct statement about which value of the QCR indicates a stronger association and then relates this to the answer given in part (a). A response that makes a correct link to the answer given in part (a) but provides a weak or incomplete explanation is considered to be partially correct for part (c).
Sample responses indicating solid understanding
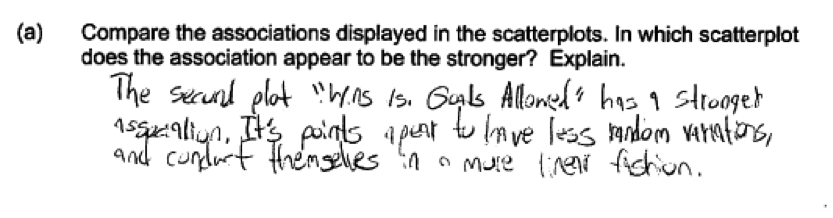
The following student response shows a good understanding of the concepts assessed by this question. In part (a) the response judges the association between wins and goals allowed to be stronger and bases this conclusion on the fact that the points in the second scatterplot “have less random variations and conduct themselves in a more fashion.” While the response would have been stronger if it had also included a more specific description of the association for the first scatterplot, this response was still scored as essentially correct for part (a).
The response in part (b) correctly calculates the QCR and shows supporting work with the correct quadrant counts, so part (b) was also scored as essentially correct. In part (c) the response indicates that the QCRs confirm the response given in part (a) and provides a good explanation of how this conclusion was reached (“-0.73 is closer to -1 (denoting a strong negative association) than 0.2 is to 1”). Part (c) was scored as essentially correct. With all three parts scored as essentially correct, this student response received a score of 4.
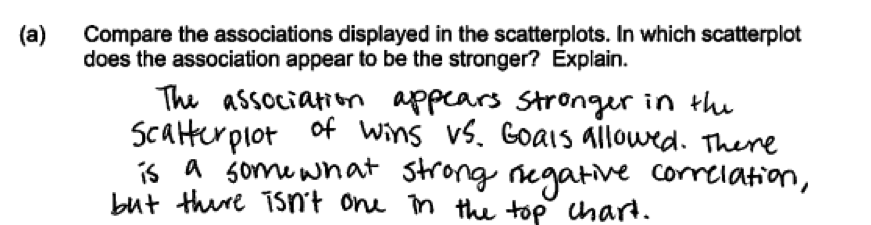
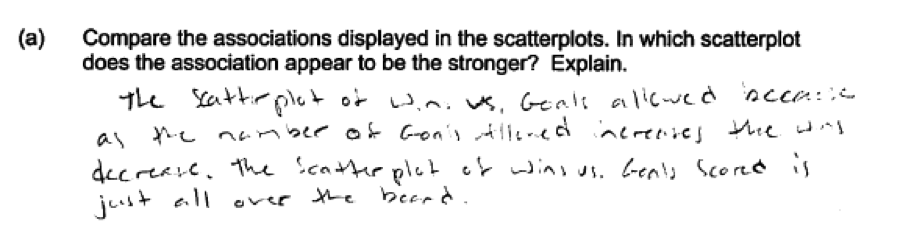
 A correct response to part (a) could be worded in several different ways. This is illustrated by the following two student responses, which were also considered to be essentially correct for part (a).
 The following student response indicates a good understanding of the content assessed in part (c). Although the explanation is not quite as complete as the one illustrated in the student response above, this response was also scored as essentially correct.
Common misunderstandings
Part (a) Describe and compare associations when data are represented in a scatterplot
In responding to part (a), it was clear that some students did not have a complete understanding of association between two numerical variables. In particular, the negative association exhibited in the scatterplot of wins versus goals allowed confused some students who may not have previously encountered the concept of negative association. For example, in the following two student responses, the association between wins and goals scored was incorrectly chosen as the stronger association because that association appeared to be positive. These responses were scored as incorrect for part (a).
 The following five student responses were all also scored as incorrect for part (a) because they indicate a lack of understanding of the concept of association.
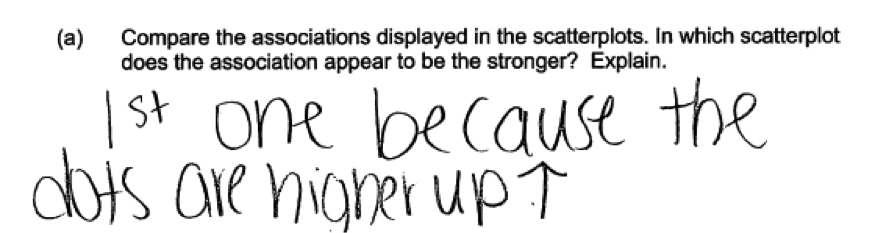

 Also in part (a), many students had difficult in describing the associations in the two scatterplots, resulting in what was considered a weak or incomplete explanation/justification for the choice of which scatterplot displayed the stronger association. The four student responses below are examples of responses that were scored as partially correct for part (a) for this reason.

Part (b) Calculate a Quadrant Count Ratio, QCR
Many students had difficulty computing the QCR and were not able to follow the example provided. A few students actually found correct quadrant counts, but then made an error in calculating the QCR. This is illustrated by the following student response which shows correct quadrant counts, but then uses an incorrect denominator in the calculation of the QCR. This response was considered to be partially correct for part (b).
 Other students had difficulty calculating the QCR because they mislabeled the quadrants in the given scatterplot. This following student response is an example of this error.
 Other students used incorrect numbers in the calculation of the QCR. This is illustrated by the following two student responses. In the first response, the means for wins and goals allowed are used in the calculation rather than the quadrant counts. In the second response below, the quadrant counts from the example that used wins and goals scored are used rather than the quadrant counts for the given scatterplot for wins and goals allowed. Both of these responses were scored as incorrect for part (b).
Part (c) Assess strength of association using the QCR
In part (c) there were three common student errors: (1) providing an incomplete or missing explanation and (2) misinterpreting the QCR. The following student response was scored as only partially correct because although the response answers the question and links the response to the answer from part (a), it does not provide an explanation for why the QCR values confirm the answer from part (a).
 The following student response is an example of the second common error in part (c), and illustrates a misinterpretation of the QCR. This response is considered incorrect for part (c).
Resources
More information about the topics assessed in this question can be found in the following resources.
Free Resources
Guidelines for Assessment and Instruction in Statistics Education (GAISE)
Published by the American statistical Association, this document contains a discussion of measuring strength of association between two quantitative variables that includes a discussion of the QCR (pages 48 – 51).
Resources from the American Statistical Association
Bridging the Gap Between Common Core State Standards and Teaching Statistics is a collection of investigations suitable for classroom use. This book contains a section on exploring relationships (Section 5) that contains several relevant activities. Investigation 5.1 (Do Names and Cost Relate? Pages 164 - 174) focuses on describing relationships in data represented in a scatterplot. Investigation 5.2 (How Tall Were the Ancestors of Laetoli? Pages 175 – 187) includes an introduction to the QCR and is very similar in content to the Locus question discussed here.
Resources from the National Council of Teachers of Mathematics
The NCTM publication Developing Essential Understanding of Statistics in Grades 6 – 8 includes a discussion of association between two variables as “Big Idea #3 (pages 56 – 62). In the subsection titled Correlation Coefficients, there is a discussion of the QCR (pages 59 – 62).