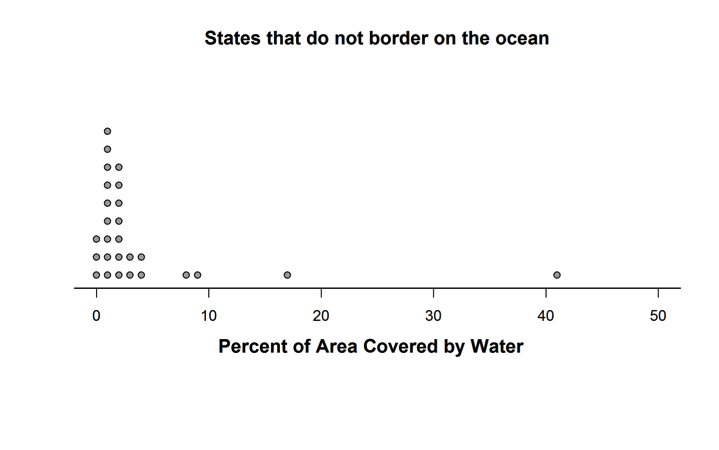
Carlton found data on the percent of area that is covered by water for each of the 50 states in the U.S. He made the dotplots below to compare the distributions for states that border an ocean and states that do not border an ocean.
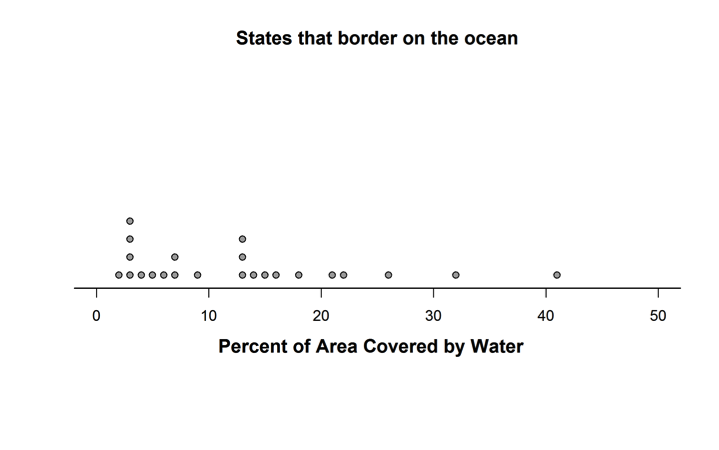
Which of the following is the best statistical reason for using the median and interquartile range (IQR), rather than the mean and standard deviation, to compare the centers and spreads of these distributions?
(A) The mean and standard deviation are more strongly influenced by outliers than the median and IQR.
(B) The median and IQR are easier to calculate than the mean and standard deviation.
(C) The two groups contain different numbers of states, so the standard deviation is not appropriate.
(D) The two distributions have the same shape.
Standards
S-ID.1: Represent data with plots on the real number line (dot plots, histograms, and box plots).
S-ID.2: Use statistics appropriate to the shape of the data distribution to compare center (median, mean) and spread (interquartile range, standard deviation) of two or more di"erent data sets.
S-ID.3: Interpret di"erences in shape, center, and spread in the context of the data sets, accounting for possible e"ects of extreme data points (outliers).
Correct answer and commentary
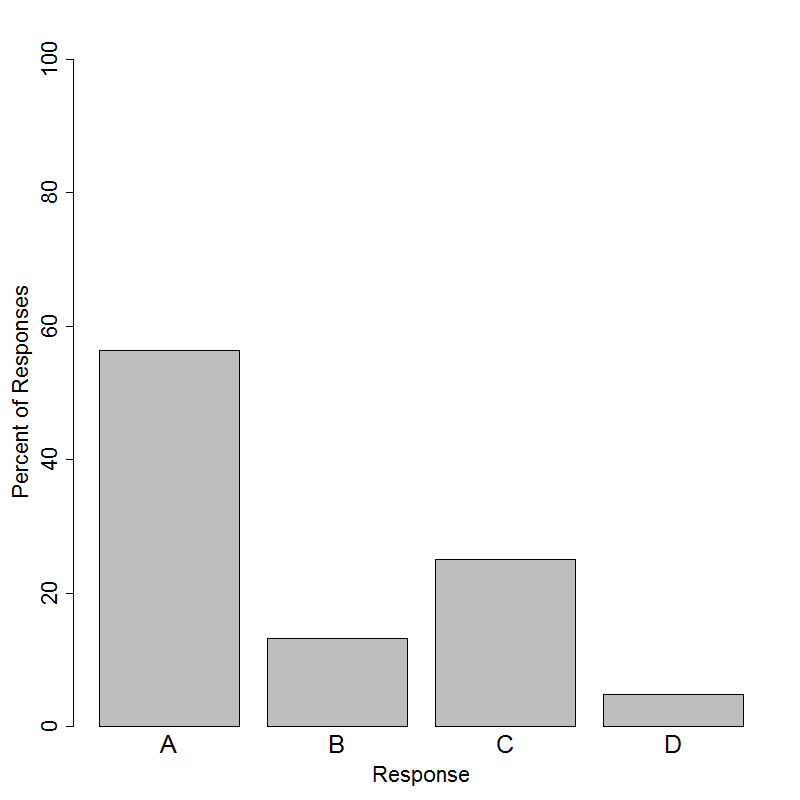
Student performance
This question requires students to identify an explanation of why the median and interquartile range (IQR) are better for comparing the two distributions than the mean and standard deviation; implicit in this task is that students can understand what the dotplots display. Extreme points (possible outliers) are present in both distributions, and such points have a strong influence on the mean and the standard deviation. The correct answer is Option (A), because the median and IQR are less sensitive to outliers.
The median and IQR may be easier to calculate than the mean and standard deviation, but this is not a statistical reason to prefer them, thus eliminating Option (B) as the correct answer. In professional statistical practice, all such statistics will be calculated by computer software which renders the calculations equally simple. Option (C) reflects a misconception that the standard deviation is only appropriate for comparing groups with equal numbers of observations, which is incorrect. Lastly, Option (D) is not the correct answer because 1) the distributions do not have the same shape and 2) having the same shape is neither a requirement of nor an impediment to use of the mean and standard deviation.