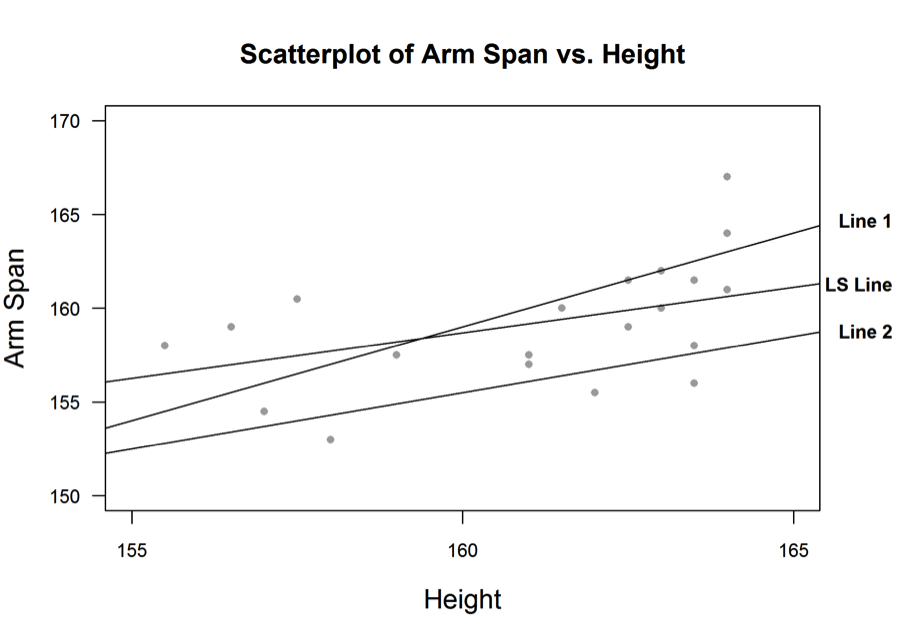
The scatterplot below shows the relationship between height and arm span for a group of students. The least squares line (labeled LS line) and two other lines have been added to the scatterplot.
Which of the following is correct?
(A) Compared to the other lines, Line 1 has the smallest sum of squared residuals.
(B) The sum of squared residuals for Line 1 is greater than the sum of squared residuals for Line 2.
(C) Compared to the other lines, the least squares line has the smallest sum of squared residuals.
(D) The sum of squared residuals for the least squares line is greater than the sum of squared residuals for Line 2.
Standards
S-ID.6b: Represent data on two quantitative variables on a scatter plot, and describe how the variables are related by Informally assessing the fit of a function by plotting and analyzing residuals.
Correct answer and commentary
Student performance
The correct answer to this question is Option (C). The least squares line is the line on a scatterplot that minimizes the sum of squared residuals, or, in other words, minimizes the total squared vertical distance between the line and each data point
Let’s take a look at the other choices to see why they are incorrect. Line 1 looks like it goes through some of the data points and is fairly close to the least squares line. Since line 2 lies well below most of the points, line 1 has appears to have a smaller sum of squared residuals than line 2. However, since line 1 is not the least squares line, it must have a higher sum of squared residuals than the LS line and option (A) cannot be correct. Option (B) was the most popular incorrect answer choice. For the reasons described above, it appears that the sum of squared residuals for line 1 is less than the sum of squared residuals for line 2. Option (D) cannot be true because the sum of squared residuals for the least squares line is the smallest of any of these other lines.