Question:
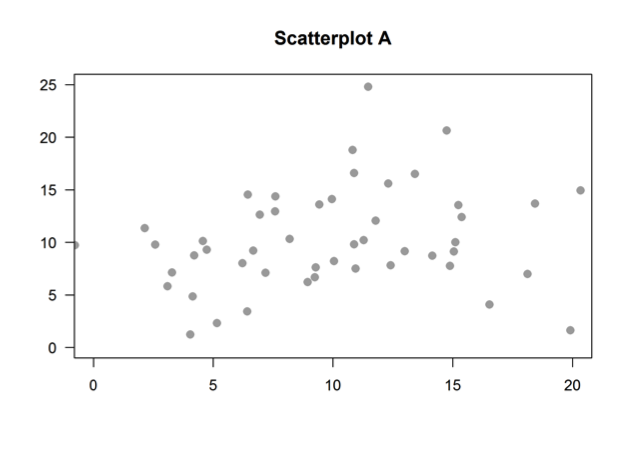
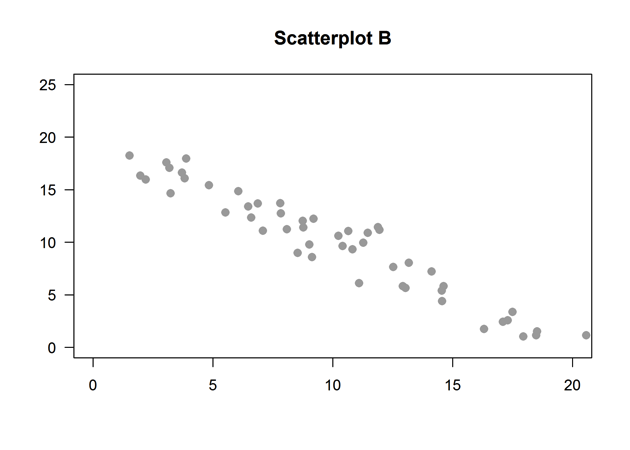
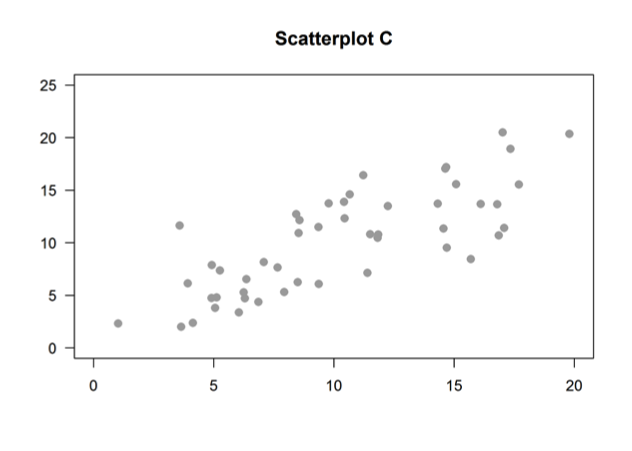
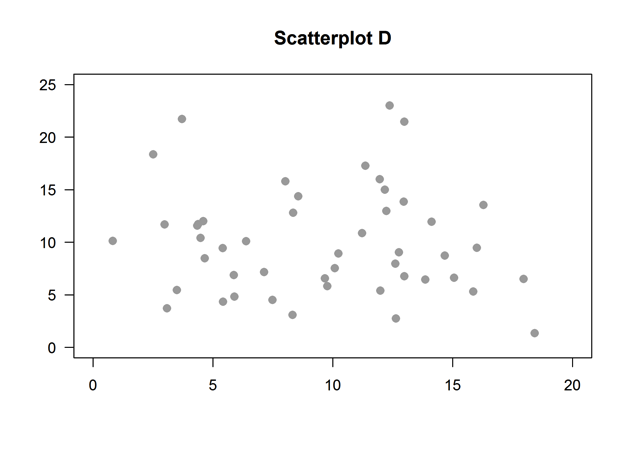
The correlation coefficients calculated from the data sets used to construct the scatterplots below are –0.96, –0.07, 0.14, and 0.80. Which of the four scatterplots corresponds to a correlation coefficient of 0.80?
(A)
 (B)
(B)
 (C)
(C)
 (D)
(D)
Level:
Advanced
Standards
S-ID.6: Represent data on two quantitative variables on a scatter plot, and describe how the variables are related.
S-ID.8: Compute (using technology) and interpret the correlation coe!cient of a linear fit.
Correct answer and commentary
Student performance
The correct answer for this question is Option (C). This question assesses students’ ability to connect correlation coefficients (which quantify the strength of linear relationships) and their corresponding scatterplots (which graphically display the relationship between two quantitative variables).
To correctly answer this question, students need to understand what type of relationship the correlation coefficient represents and recognize the same relationship in the scatterplot. The scatterplots are displayed in the order, 0.14, -0.96, 0.80, and -0.07. The most popular incorrect answer choice was option (B), which displays a strong linear relationship that is negative instead of positive. Note that the scatterplots for -0.07 and 0.14 can be difficult to distinguish, because they both display relationships that are quite weak.
While students should have an intuitive feel for what different values of the correlation coefficient might look like on a scatterplot, plotting data is an absolute necessity as part of data analysis. Students must understand that one cannot rely on the correlation coefficient alone to determine the relationship present in the data. To illustrate this point, Anscombe’s Quartet provides a good example of how the displays of four datasets with identical summary statistics, correlation coefficients, and linear regression equations (up to a certain number of decimals) visually differ. Data analysis should always involve data displays and not rely exclusively on numerical summaries.