Last year, a college baseball team played about half of the games at its home stadium and the rest away from home. The results of all of the games are recorded in the two-way table below.
| Home | Away | Total | |
| Win | 25 | 14 | 39 |
| Loss | 8 | 17 | 25 |
| Total | 33 | 31 | 64 |
The coach believes that the team has a home field advantage, which means that the team is more likely to win games played at its home stadium than away from home. Which of the following provides the best evidence to support the claim that there is a home field advantage for this baseball team?
(A) The team won 76% (25/33) of the home games and 45% (14/31) of the away games.
(B) 39% (25/64) of the games were wins at home, and this was the most frequent outcome.
(C) The team won 61% (39/64) of the games, and played at home for 52% (33/64) of the games.
(D) A home field advantage typically exists for college baseball teams.
Standards
8.SP.4: Understand that patterns of association can also be seen in bivariate categorical data by displaying frequencies and relative frequencies in a two-way table. Construct and interpret a two-way table summarizing data on two categorical variables collected from the same subjects. Use relative frequencies calculated for rows or columns to describe possible association between the two variables. For example, collect data from students in your class on whether or not they have a curfew on school nights and whether or not they have assigned chores at home. Is there evidence that those who have a curfew also tend to have chores?
S-ID.5: Summarize categorical data for two categories in two-way frequency tables. Interpret relative frequencies in the context of the data (including joint, marginal, and conditional relative frequencies). Recognize possible associations and trends in the data.
S-CP.4: Construct and interpret two-way frequency tables of data when two categories are associated with each object being classified. Use the two-way table as a sample space to decide if events are independent and to approximate conditional probabilities. For example, collect data from a random sample of students in your school on their favorite subject among math, science, and English. Estimate the probability that a randomly selected student from your school will favor science given that the student is in tenth grade. Do the same for other subjects and compare the results.
Correct answer and commentary
Student performance
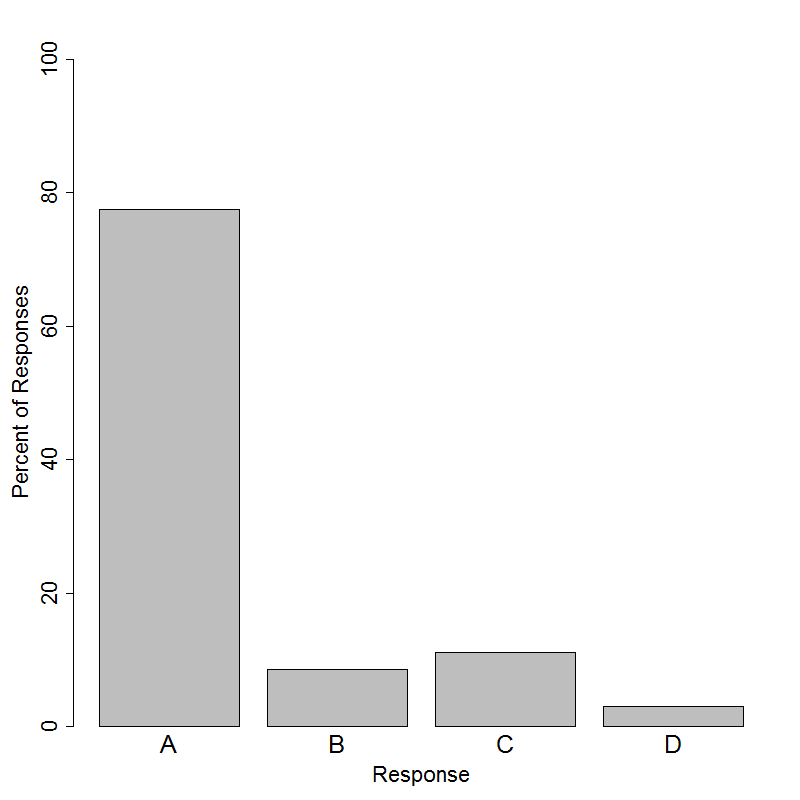
The correct answer to this question is Option (A). To support the claim of a home field advantage, students must find evidence of an association between where the game is played and the outcome of the game. This association, if it exists, would have to indicate that a team is more likely to win at home than away; otherwise, the association would be an ‘away field advantage.’ Option (A) does that by calculating and comparing two conditional relative frequencies; more specifically, it calculates the proportion of games in the Win category for two different conditions: games played at home and games played away from home. Among games played at home, the team won 76% (25/33) of the games; among games played away from home, the team won 45% (14/31) of the games. Because the relative frequency of winning was higher for games played at home, there is evidence of a home field advantage. 77% of students answered this question correctly.
None of the other answer choices provide appropriate evidence of a home field advantage. Option (D) merely appeals to pre-existing assumptions about a home field advantage; it does not provide any evidence based on data.
Option (B) provides the proportion of all of last year’s games in which the team both played at home and won. Although this was the most frequent outcome, it is not appropriate evidence of a home field advantage, because it cannot be fairly compared to other possible outcomes. The number of home games is larger than the number of away games, and the number of wins is larger than the number of losses, so we would expect for there to be many wins at home even without a home field advantage. The most popular incorrect answer, Option (C), points out that the team won 61% of the games and played at home for 52% of the games.
Because both of these outcomes occur more than half the time, student may believe that the two are related. In reality, these marginal relative frequencies, calculated by dividing a row or column total by the overall total, only consider one variable at a time. These proportions tell us about the overall distribution of wins/losses and the overall distribution of home/away games, but they tell us nothing about the relationship between the two.