Students wanted to investigate whether the distance a male student can jump is affected by having a target to jump toward.
The students decide to perform an experiment comparing two groups. One group will have male students jumping toward a fixed target, and the other group will have male students jumping without a fixed target. There are 28 male students available for the experiment.
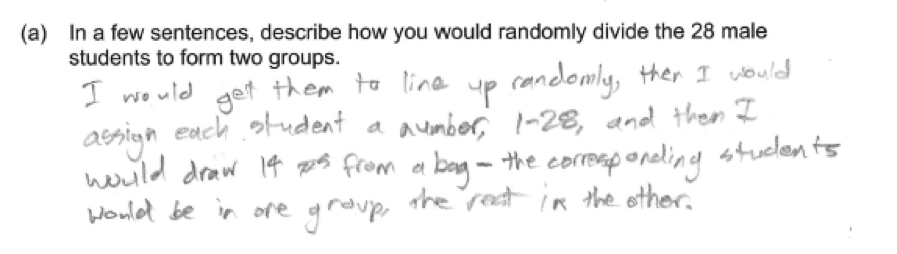
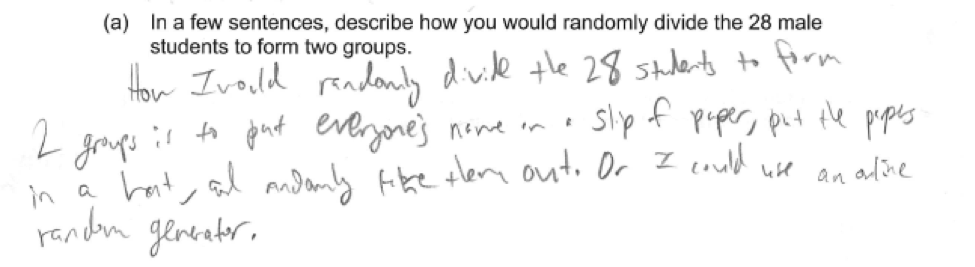
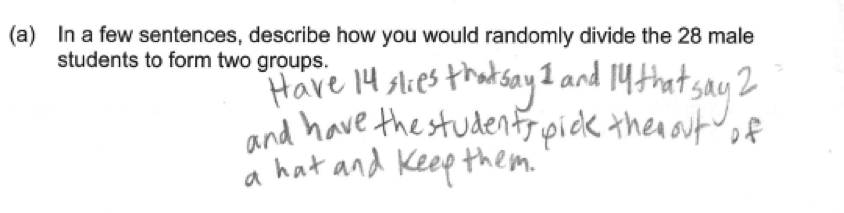
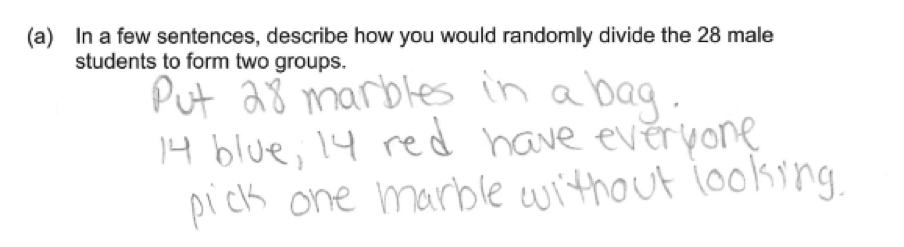
(a) In a few sentences, describe how you would randomly divide the 28 male students to form two groups.
After forming the two groups, data were collected on the length (in centimeters) of the jump for each male student. The data for 28 male students are summarized in the boxplots below.
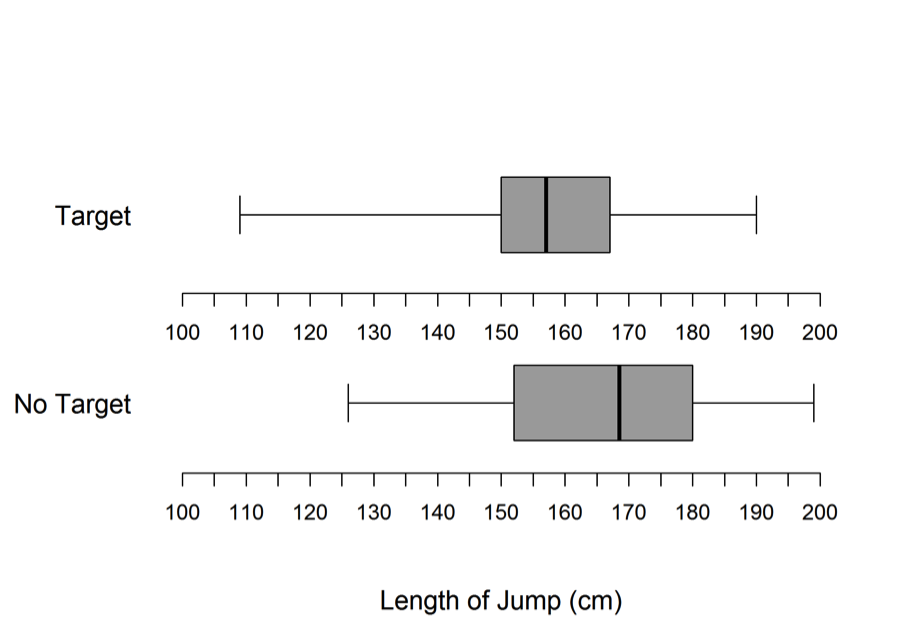
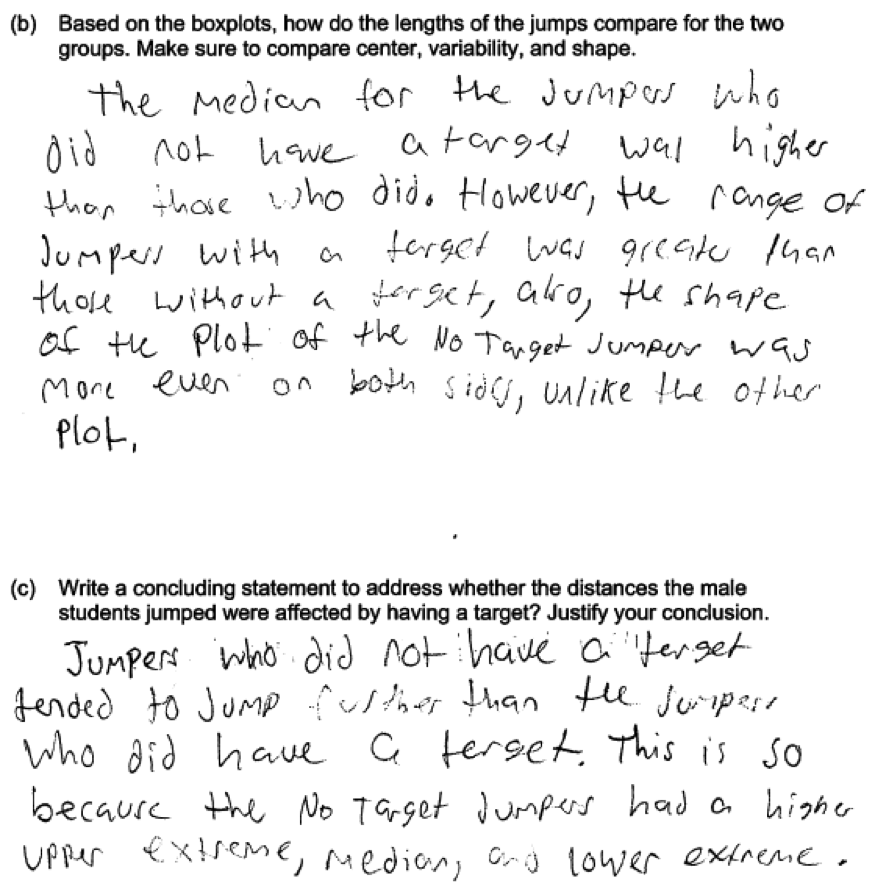
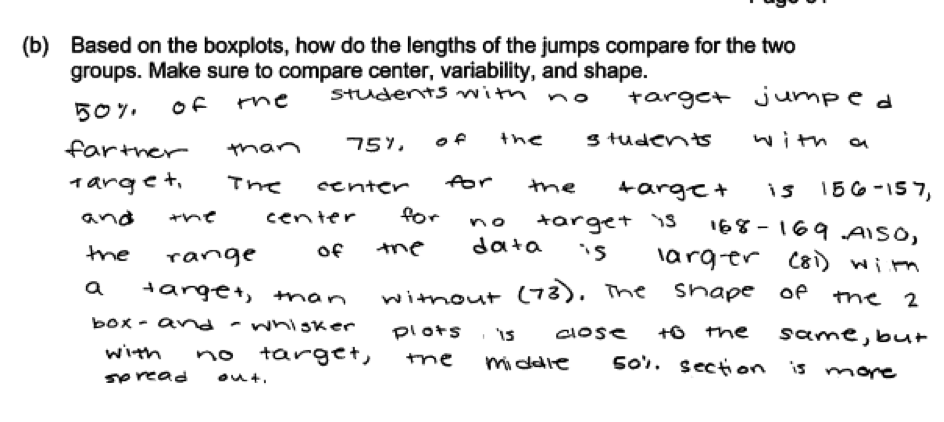
(b) Based on the boxplots, how do the lengths of the jumps compare for the two groups. Make sure to compare center, variability, and shape.
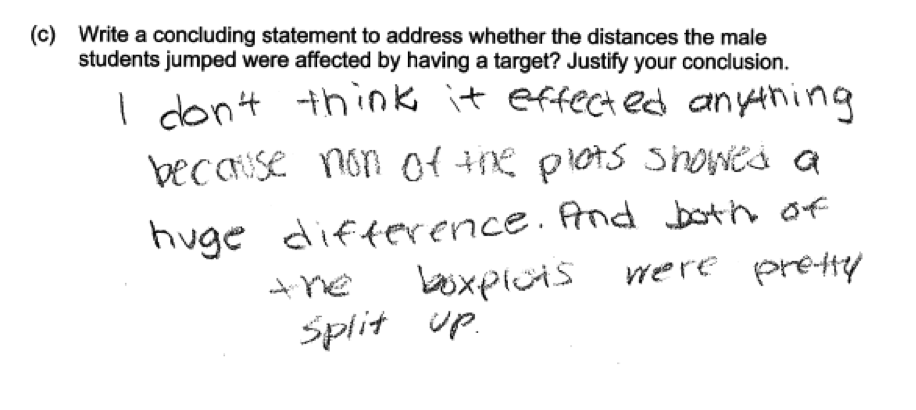
(c) Write a concluding statement to address whether the distances the male students jumped were affected by having a target? Justify your conclusion.
Overview of the question
This question is designed to assess the student’s ability to:
1. Describe a process for randomly assigning subjects to treatments in an experiment (part (a)).
2. Compare two groups based on a boxplots (part (b)).
3. Use boxplots to draw a conclusion about group differences and provide an informal justification to support the conclusion (part (c)).
Ideal response and scoring
Part (a):
An ideal response to part (a) recognizes that the students should be assigned to the two groups using some form of random assignment. To be considered essentially correct, the response needed to provide enough detail about the random assignment process so that someone reading the description could implement the process. Ideally, the random assignment described would result in two groups of equal size (14 students in each group), but schemes that used random assignment that might result in groups of different sizes (for example, flipping a coin for each student to determine the group to which the student would be assigned) are also considered to be essentially correct.
Responses that incorporated random assignment, but did not provide sufficient detail are scored as partially correct. If the process described did not include random assignment in any form, the response is considered to be incorrect.
Part (b):
Part (b) asks students to compare two groups based on boxplot. An ideal response to part (b) is one that provides a comparison of (1) center, (2) spread, and (3) shape and which uses comparative language (smaller, larger, greater, lesser, etc.) in at least two of these three comparisons.
Responses that compare the distributions on two of center, spread and shape are considered to be partially correct. Responses that fail to actually compare the two distributions are considered incorrect.
Part (c):
Part (c) asks students to reach an informal conclusion regarding whether jump distance is affected by whether or not the students jumping were given a target and to justify the conclusion.
An ideal response to part (c) is one that provides the conclusion and with an appropriate justification based on the boxplots provided. Because the boxplots overlap, either conclusion is acceptable, as long as the conclusion is adequately justified. If a justification is provided, but no clear conclusion is stated the response is considered to be partially correct. Responses that give a conclusion but for which the justification is weak or poorly communicated are also considered to be partially correct.
Sample responses indicating solid understanding
Part (a) asks students to describe a process for randomly assigning subjects to treatments in an experiment. There are a number of correct ways that this could be done, including drawing names from a hat, assigning each student a number and using a random number generator or some other random process to select which students will be in each of the two groups, and flipping a coin for each student to determine the group to which the student would be assigned.
The four student responses that follow are all different in terms of the actual method described, but all are correct in the way that random assignment is incorporated. Each of these four responses received a score of essentially correct for part (a).
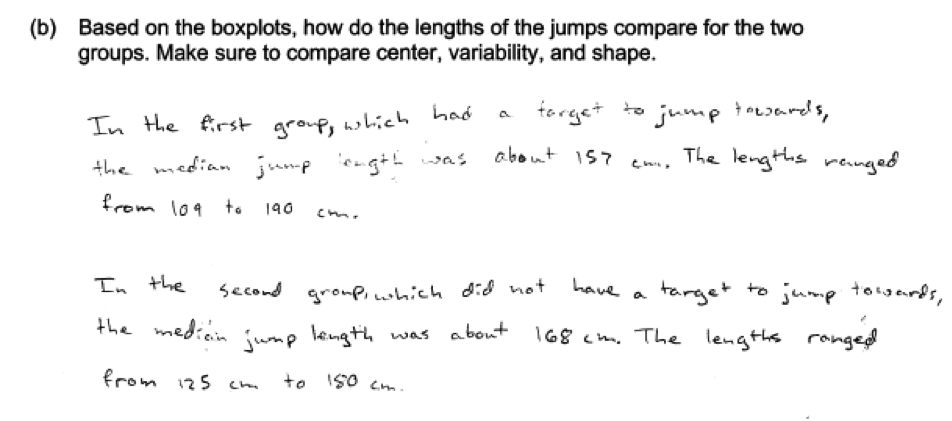
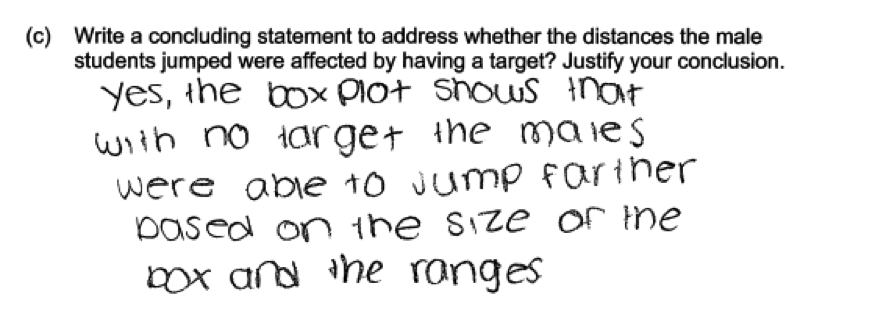
 Parts (b) and (c) asked students to compare distances jumped for the two groups, to reach a conclusion based on the boxplots provided, and to justify that conclusion. The following student response shows a good understanding of the concepts assessed in these two parts and received a score of essentially correct for both parts (b) and (c). The response to part (b) compares the groups based on all three of center, spread and shape. The response in part (c) provides a conclusion and justifies it based on the relative values of the minimum, maximum and median.
 There were also other correct ways that a student might respond to part (b). For example, the following student response notes that the median of no target group is about the same as the upper quartile for the target group and that the no target group is centered at a higher value than the target group. There is a comparative statement about shape (“about the same”), and spread is addressed in the statement about the spread of the middle 50%.
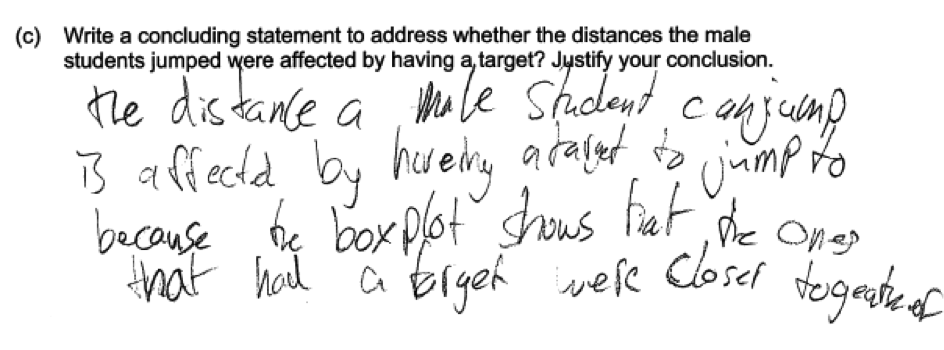
 In part (c), because the two boxplots overlap, it was also possible to conclude that the presence of a target did not have an effect as long as the justification talks about the overlap or about the similarity of the two boxplots, as illustrated in the following student response.
Common misunderstandings
Part (a) Describe a process for randomly assigning subjects to treatments in an experiment
Responses that were not considered essentially correct on part (a) generally made one of two errors. Some incorporated random assignment but did not provide sufficient detail when describing the process. To be considered as essentially correct, the response should provide someone reading the response with enough information to implement the plan. This error is illustrated in the following student response which was scored as only partially correct for part (a).
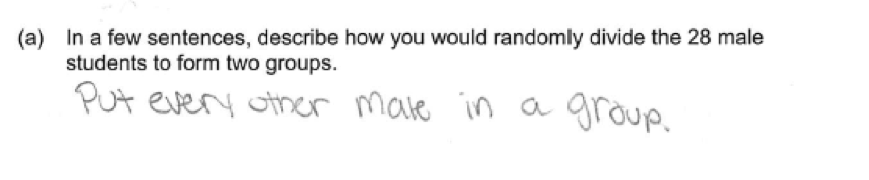
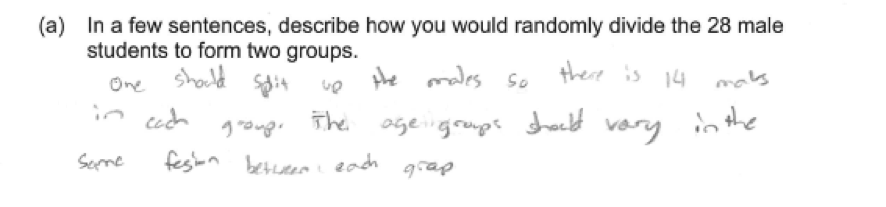
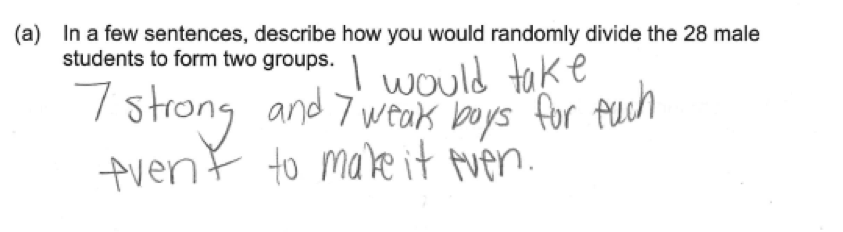
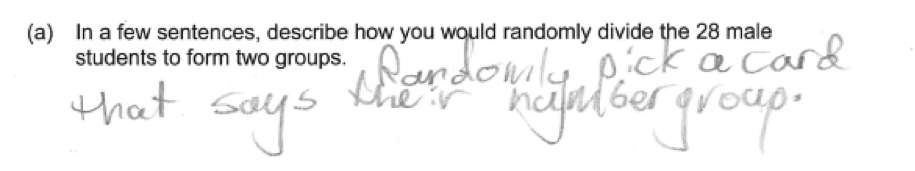 The other common student error on part (a) was failure to address the need for random assignment when creating the two groups. This is illustrated in the following three student responses, which were all scored as incorrect for part (a).
Part (b) Compare two groups based on a boxplots
In part (b), students were required to use comparative statements when describing the two groups. Some students described center, spread and shape for each distribution, but failed to actually compare the two distributions. This error is illustrated in the following student response.
 The following student response also gives separate descriptions of the two groups. While there is one comparative statement (“the range is not as large”), there is no comparison of center or shape.
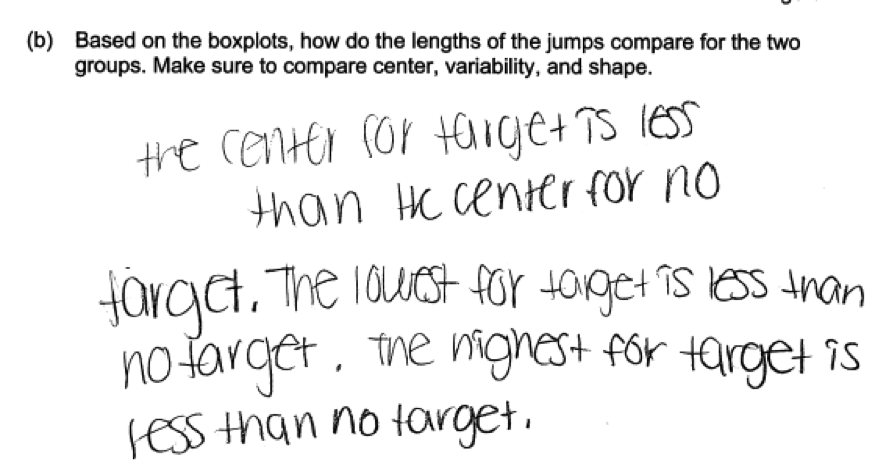
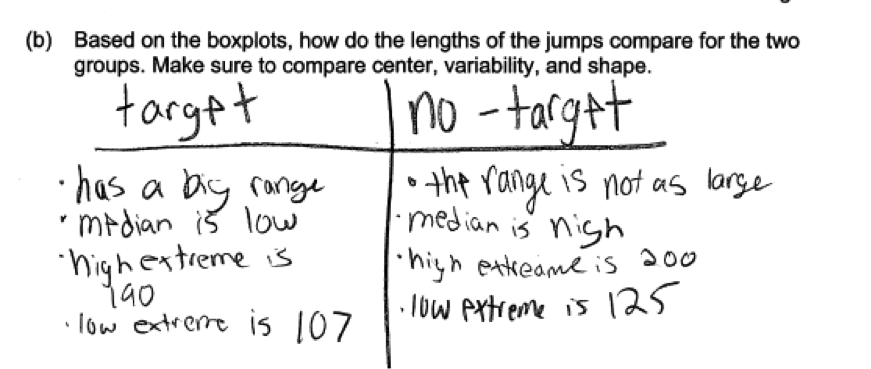 By far the most common student error on part (b) was failure to address all of center, spread and shape. Many students included a comparison of center and variability, but did not mention shape. For example, the following student response compares centers, but spread is only addressed indirectly and shape is not mentioned.
Part (c) Use boxplots to draw a conclusion about group differences and provide an informal justification to support the conclusion
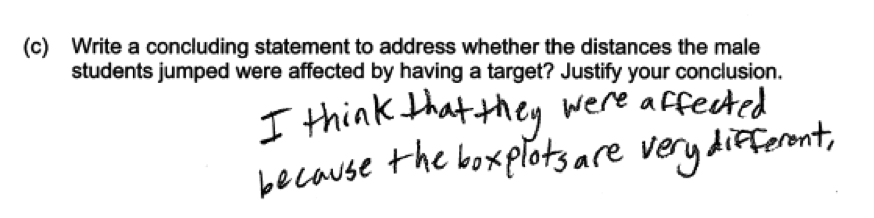
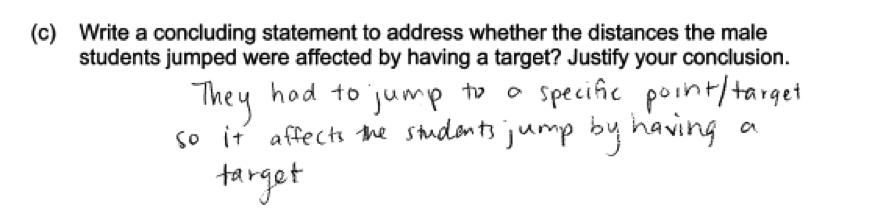
Many students struggled with part (c). Some stated a conclusion, but provided a weak or incomplete explanation, while others failed to state a conclusion. For example, in the student response below, there is no conclusion about whether the distances the male students jumped were affected by having a target, and was considered as only partially correct for this reason.
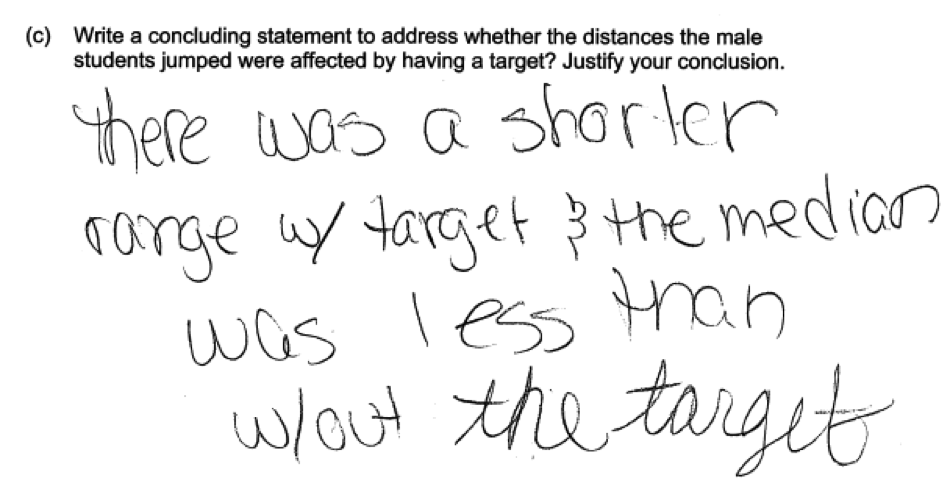 The following student three responses are ones that were scored as partially correct because the justification was judged to be weak.
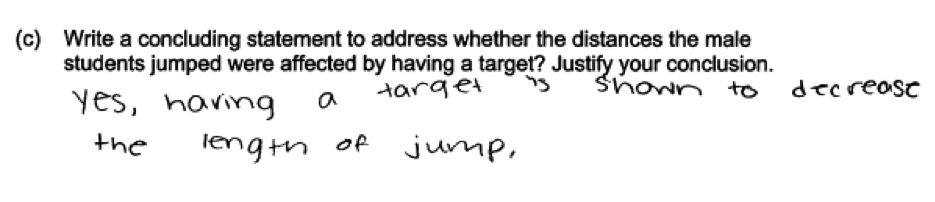
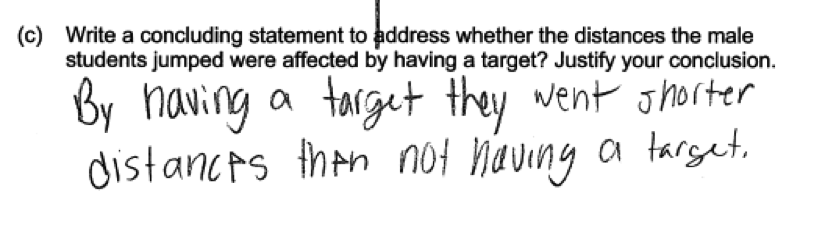
 Responses that did not provide any justification are considered to be incorrect for part (c). The following three student responses illustrate this, and were all scored as incorrect for part (c).
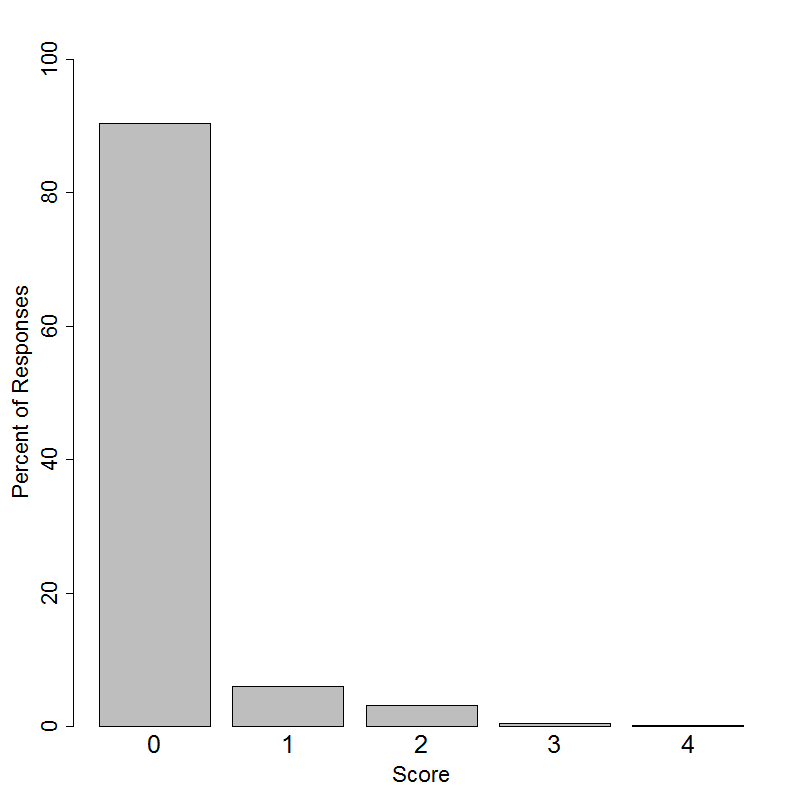
Student performance
Resources
Free Resource
Lessons
Statistics Education on the Web (STEW) has peer reviewed lessons plans that can be found at http://www.amstat.org/education/stew/index.cfm. Some lessons related to the topic of this question are
Classroom and Assessment Tasks
Illustrative Mathematics has peer reviewed tasks that are indexed by Common Core Standard.
A task that focuses on describing distributions is
Three tasks that focus on comparing two groups based on box plots that could be completed by students or used as the basis of a classroom discussion are
Guidelines for Assessment and Instruction in Statistics Education (GAISE)
Published by the American Statistical Association and available online at, this document contains a discussion on comparing distributions using boxplots (pages 52 – 54). There is also a nice discussion on the purpose of random assignment in an experiment (pages 54-55) that relates to the content assessed in part (a) of this question.
Resources from the American Statistical Association
Bridging the Gap Between Common Core State Standards and Teaching Statistics is a collection of investigations suitable for classroom use. This book contains a section on comparing distributions (Section 4) that contains four activities. Activity 4.1 (How Far Can You Jump, pages 112 – 125) is actually the basis for this LOCUS question. and a section on comparing groups (Section 4).
Resources from the National Council of Teachers of Mathematics
The NCTM publication Developing Essential Understanding of Statistics in Grades 6 – 8 includes a section on comparing distributions on pages 42 – 50.It includes a discussion of an example similar to this question in which two brands of antacid are compared based on two boxplots.