Each student in a class selected a random sample of 25 marbles from a large jar of red and white marbles and then determined the proportion of red marbles in his or her sample. The proportion in one student’s sample was 0.28. The two people sitting beside that student got sample proportions of 0.36 and 0.24. Of the following, which gives the best explanation for the differences in the sample proportions?
(A) Sample proportions will generally differ from one random sample to another.
(B) Only one of the students knew the true proportion of red marbles.
(C) Two of the three students obtained bad samples.
(D) Two of the three students miscalculated the percentages.
Standards
7.SP.1: Understand that statistics can be used to gain information about a population by examining a sample of the population; generalizations about a population from a sample are valid only if the sample is representative of that population. Understand that random sampling tends to produce representative samples and support valid inferences.
7.SP.2: Use data from a random sample to draw inferences about a population with an unknown characteristic of interest. Generate multiple samples (or simulated samples) of the same size to gauge the variation in estimates or predictions. For example, estimate the mean word length in a book by randomly sampling words from the book; predict the winner of a school election based on randomly sampled survey data. Gauge how far off the estimate or prediction might be.
Correct answer and commentary
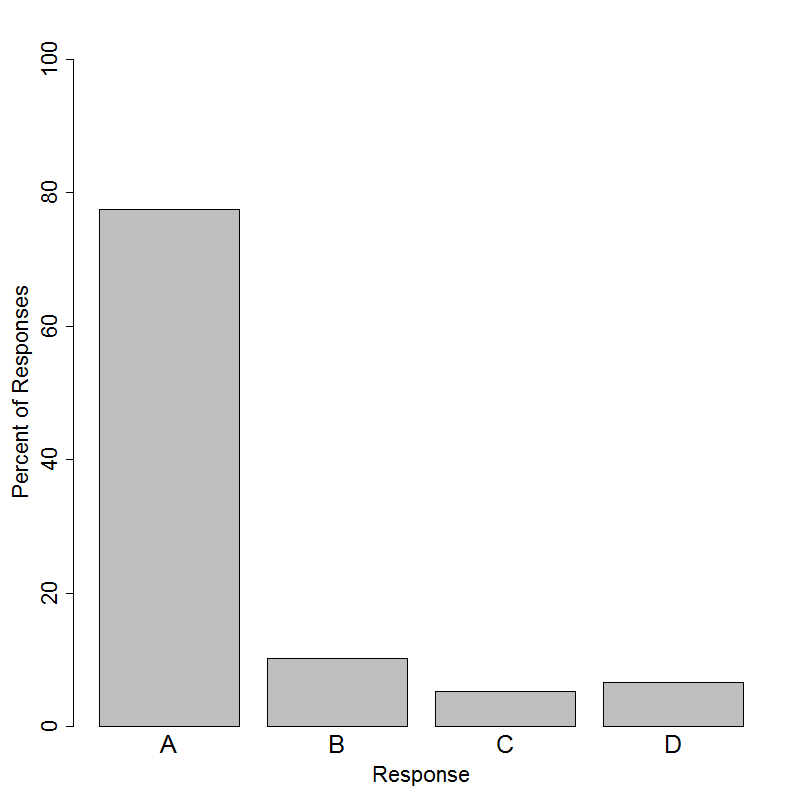
Student performance
The correct answer for this question is Option (A). Variability is ubiquitous in statistics, and students need to appreciate that variability is characteristic of real life and not an indication of some mistake on the part of the person carrying out the investigation. In a real-world situation such as drawing marbles from a large jar, students often know from their life experiences that the samples drawn by two different students are unlikely to be the same. Beginning with simple scenarios and moving on to more complex contexts, students need opportunities to experience variability in the classroom.
Other incorrect explanations that students may offer to explain this variability are “bad samples” or miscalculated percentages. These misconceptions rely on a deterministic view of the processes at hand; i.e. if only the students had been more careful about picking marbles from the jar or doing the arithmetic when calculating they would have obtained the correct proportion. Such views indicate a lack of understanding of sampling variability. Individual sample proportions provide a reasonable estimate of the true proportion in question, but because of sampling variability, we expect these sample proportions to vary somewhat.
Lastly, students choosing Option (B) may believe that their results are somehow special and different from other students’ results. That is, if they and two other students were to perform the sampling as outlined in the question, the two other students’ proportions would be wrong and the “special” student’s proportion would be right. This may be related to optimism bias, where an individual believes they are less likely than others to experience negative random events (or, conversely, more likely to experience positive random events). A student exhibiting optimism bias may believe that their sample proportion is equal to the population proportion while other students’ proportions are further from the true value. Mature statistical thinkers recognize that random chance is indiscriminate and does not favor certain individuals.