A study was carried out to investigate whether there is a relationship between the percent of hearing loss and the volume at which people typically listen to music. Ten high school students agreed to participate in a study. Each was given a music player with headphones and was asked to listen to music for 10 minutes. The students were told to adjust the volume to a comfortable setting. After 10 minutes, the volume setting, which ranges from 1 to 10, was observed for each student. Each student then took a hearing test, and a measure of hearing loss (in percent) was recorded. The data are shown in the table below.
| Volume Setting (x) | Hearing Loss (y) |
| 8 | 23 |
| 10 | 24 |
| 1 | 11 |
| 4 | 9 |
| 5 | 15 |
| 8 | 19 |
| 3 | 14 |
| 1 | 5 |
| 2 | 7 |
| 8 | 15 |
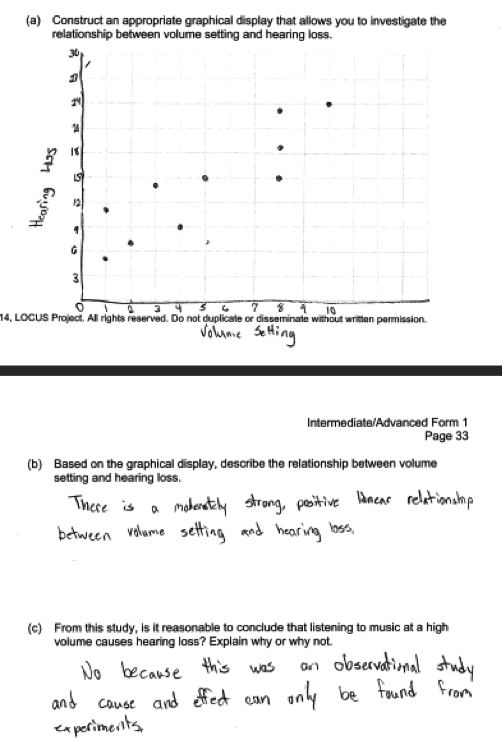
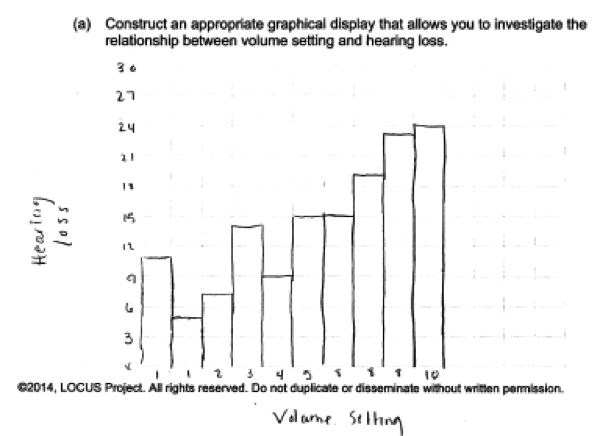
(a) Construct an appropriate graphical display that allows you to investigate the relationship between volume setting and hearing loss.
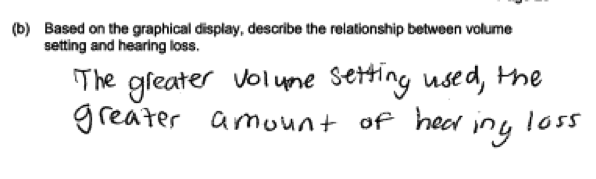
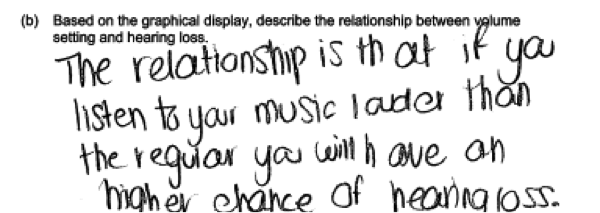
(b) Based on the graphical display, describe the relationship between volume setting and hearing loss.
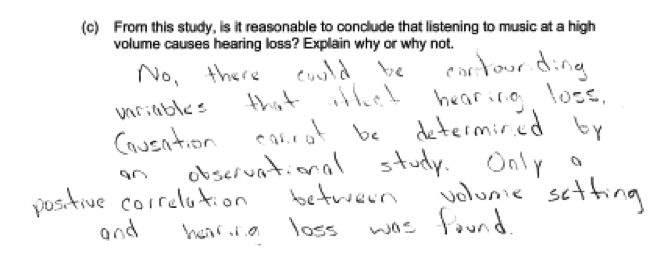
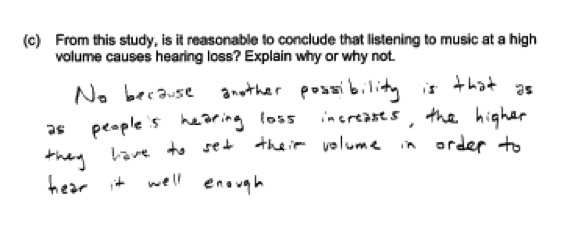
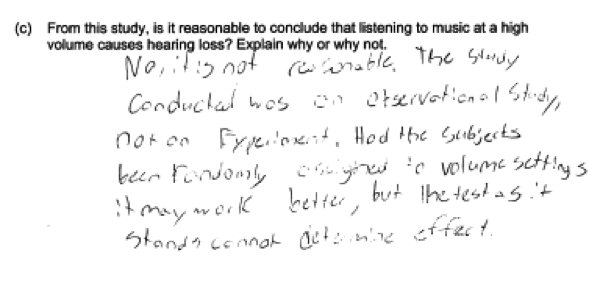
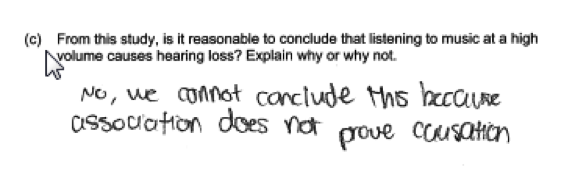
(c) From this study, is it reasonable to conclude that listening to music at a high volume causes hearing loss? Explain why or why not.
Overview of the question
This question is designed to assess the student’s ability to:
1. Create a graphical display of bivariate numerical data (part (a)).
2. Interpret graphical displays of bivariate numerical data (part (b)).
3. Distinguish between an observational study and an experiment in order to draw appropriate conclusions from a statistical study (part (c)).
Standards
- 8.SP.1: Construct and interpret scatter plots for bivariate measurement data to investigate patterns of association between two quantities. Describe patterns such as clustering, outliers, positive or negative association, linear association, and nonlinear association.
- S-IC.3: Recognize the purposes of and di"erences among sample surveys, experiments, and observational studies; explain how randomization relates to each.
Ideal response and scoring
Part (a):
An ideal response to part (a) includes a correctly drawn scatterplot of the data that includes axis labels, correct scales, and points.
Histograms and dotplots are not appropriate for bivariate data, and student responses that use these (or other one-variable graphical displays) are considered incorrect.
Part (b):
An ideal response to part (b) notes that the relationship between volume setting and hearing loss is 1) approximately linear, 2) strong, 3) positive, and 4) makes these statements in context (e.g., higher values of hearing loss tend to be paired with higher volume settings). If a response is missing one or two of these four elements, it is considered partially correct. If it is missing more than two, it is considered incorrect.
Part (c):
An ideal response to part (c) indicates that it is not reasonable to conclude that listening to music at high volume is the cause of hearing loss and provides an explanation that is linked to the study design. This might be done by indicating that the students participated in an observational study and cause-ad-effect conclusions can't be drawn from an observational study or by indicating that to reach a cause-and-effect conclusion requires a well-designed experiment. It is also possible to provide an explanation based on the fact that there may be confounding variables in an observational study, as long as this explanation includes how this might have occurred in the context of the study described.
A response with a correct conclusion but a weak or incomplete explanation is considered partially correct. A response with a correct conclusion that has a missing or incorrect explanation is considered incorrect. Responses that indicate that the conclusion is reasonable are also considered as incorrect.
Sample responses indicating solid understanding
The following student’s response shows a good understanding of the concepts assessed by this question. The scatter plot in part (a) is correctly drawn and includes axis labels and scales, so part (a) was scored as essentially correct. The response in part (b) contains all four parts and was scored as essentially correct. Part (c) was scored essentially correct because the student indicates that it is not reasonable to conclude that listening to music at high volume causes hearing loss and the brief explanation given is correctly related to study design. With all three parts essentially correct, this student response received a score of 4.
 In part (b) of this question, is it also possible to describe the direction of the relationship in words rather than just using the term “positive.” The response below describes the direction of the relationship in context. This response was scored as partially correct because although it has direction and context, it does not state that the relationship was linear or address the strength of the relationship. When describing relationships in bivariate data, students should think about the form of the relationship, direction, and strength in context.
 There are a number of ways that a student could demonstrate understanding of the concepts assessed in part (c). For example, the following responses were all scored as essentially correct for part (c):
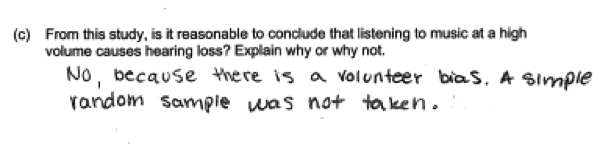
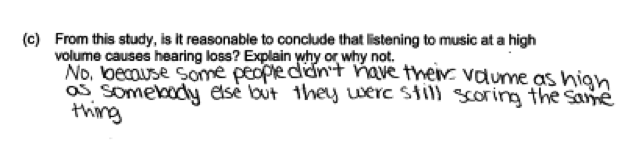
 The following response was scored as partially correct for part (c) because while the statement is true (i.e., a correct definition), there is no explanation of why not as prompted by the question. Another type of example that falls into this category are statements that said that there might be confounding variables but did not give an example of how this might limit the ability to draw a cause-and-effect conclusion in the context of this question.
Common misunderstandings
Part (a) asked students to create a graphical display of the bivariate data.
Most students recognized that the given data were bivariate and correctly chose to make a scatterplot in part (a). The most common error made by students who did not construct a scatterplot was to try to use a graphical display that is designed for univariate data rather than bivariate data. For example, some students tried to make a histogram or bar chart, as illustrated in the student response below. When selecting a graphical display, students should think about both the data type (categorical, numerical) and the number of variables.
Part (b) asked students to interpret the graphical display of bivariate data.
Two common student mistakes in part (b) were to only address the direction of the relationship in the response (omitting strength and form) and/or to give a response that was not in the context of the problem. When interpreting results or providing explanations, students should always reference the context.
The following student response to part (b) indicates direction (increasing, positive) in context, but does not address the linear trend or strength of the relationship, and was scored as partially correct.
Part (c) Draw appropriate conclusions from a statistical study
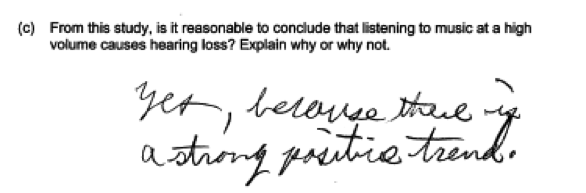
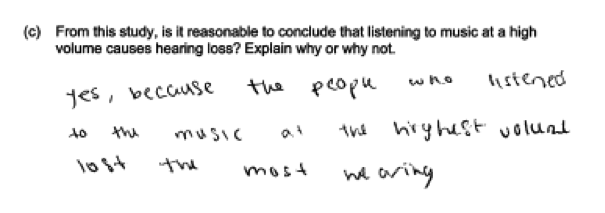
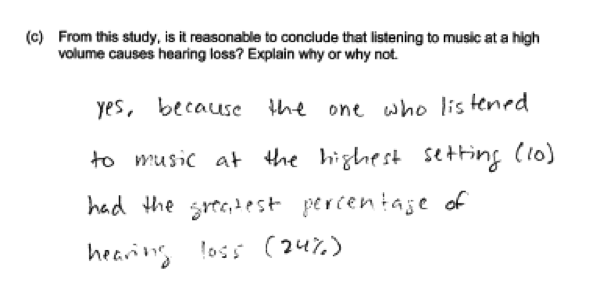
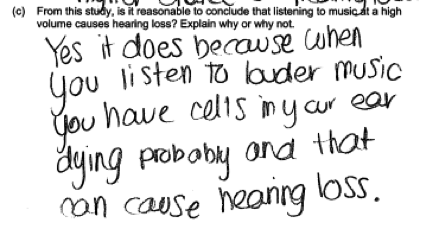
A number of student misconceptions surfaced in the student responses to part (c). A common error on this part was to think that a cause-and-effect relationship can be inferred from a strong relationship without taking study design into consideration. This is illustrated in the following student responses:
 Some students indicated that it was not reasonable to draw a cause-and-effect conclusion based on the data from this study, but gave an incorrect reason. Incorrect reasons included thinking that no conclusions can be drawn from any study that involves volunteers or that no conclusions can be drawn because the sample size was small.
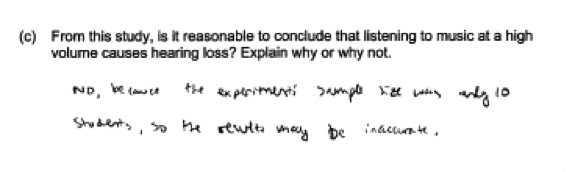
While it is true that a larger sample size would be desirable, the small sample size is not the reason that a cause-and-effect conclusion cannot be drawn. Similarly, while a study that involved randomly selecting participants from some larger group would allow generalization of the findings of the study, this is not a reason that a cause-and-effect conclusion cannot be drawn. It would be possible to design an experiment that used volunteers to investigate the effect of sound volume on hearing, but this would require random assignment of volunteers to sound volume groups as well as looking at exposure to loud volumes over time as hearing loss is not instantaneous.
Another error in thinking is seen in the response that follows. In this response, the student believes that any cause-and-effect relationship would have to be deterministic, which is not always the case.
 Finally, some students erroneously justified their response to part (c) based on personal beliefs without using the given data or the answers given in parts (a) and (b), as illustrated in the following response.
Student performance
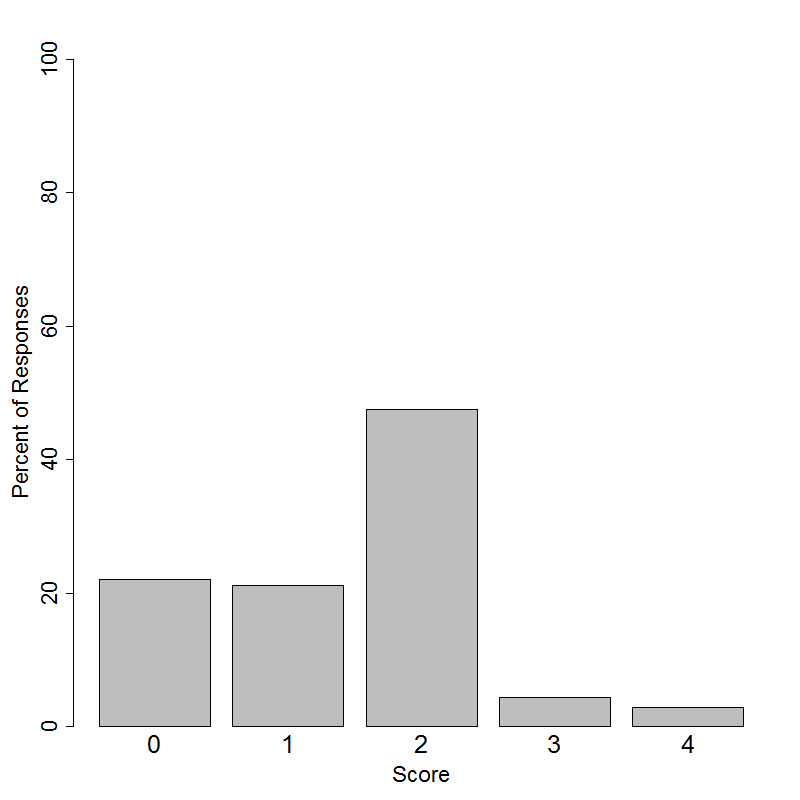
This item was administered to students in grades 6-12. Students in grades 6-9 had the following distribution of scores on a 4-point scale.
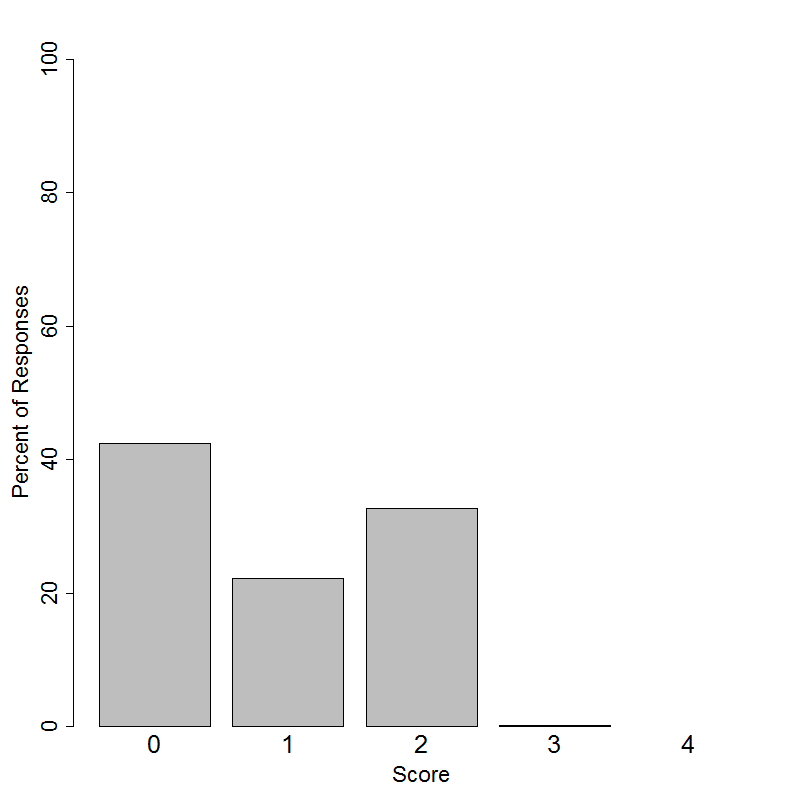 This item was administered to students in grades 6-12. Students in grades 10-12 had the following distribution of scores on a 4-point scale.
Resources
Study design and the conclusions that can be drawn from various types of studies is an important concept in the development of students’ statistical literacy.
More information about this topic can be found in the following resources.
Free Resources
- Lessons
- Statistics Education on the Web (STEW) has peer reviewed lessons plans that can be found at http://www.amstat.org/education/stew/index.cfm. Two lessons related to the topic of this question are:
- Webinars
- The American Statistical Association has a number of webinars on its web site.
- One webinar related to the topic of this question is the one titled “An Elementary Introduction to Experimental Design”.
- The American Statistical Association has a number of webinars on its web site.
Classroom and Assessment Tasks
Illustrative Mathematics has peer-reviewed tasks that are indexed by Common Core Standard. Standard S.IC.3 is relevant to the issue of distinguishing between observational studies and experiments and the types of conclusions that can be drawn in each case. Two tasks relevant to this standard are
Guidelines for Assessment and Instruction in Statistics Education (GAISE)
Published by the American statistical Association and freely available online, this document contains a discussion of observational studies and experiments on pages 52 – 55.
Common Core Progressions Documents
A discussion of the intent of Common Core standard S.IC.3 and how this content might be developed in the classroom can be found in Common Core Tools progressions document for statistics in grades 9 – 12. See the discussion of standard S.IC.3.
Other Resources from the American Statistical Association
Making Sense of Statistical Studies is a collection of investigations suitable for classroom use. The Introduction provides an overview of the statistical problem solving process and includes a discussion of observational studies and experiments.
Resources from the National Council of Teachers of Mathematics
The NCTM publication Developing Essential Understanding of Statistics for Teaching Mathematics in Grades 9 – 12 includes a section on the big idea “Importance of the Data Collection Method” in the discussion on pages 57 – 66.