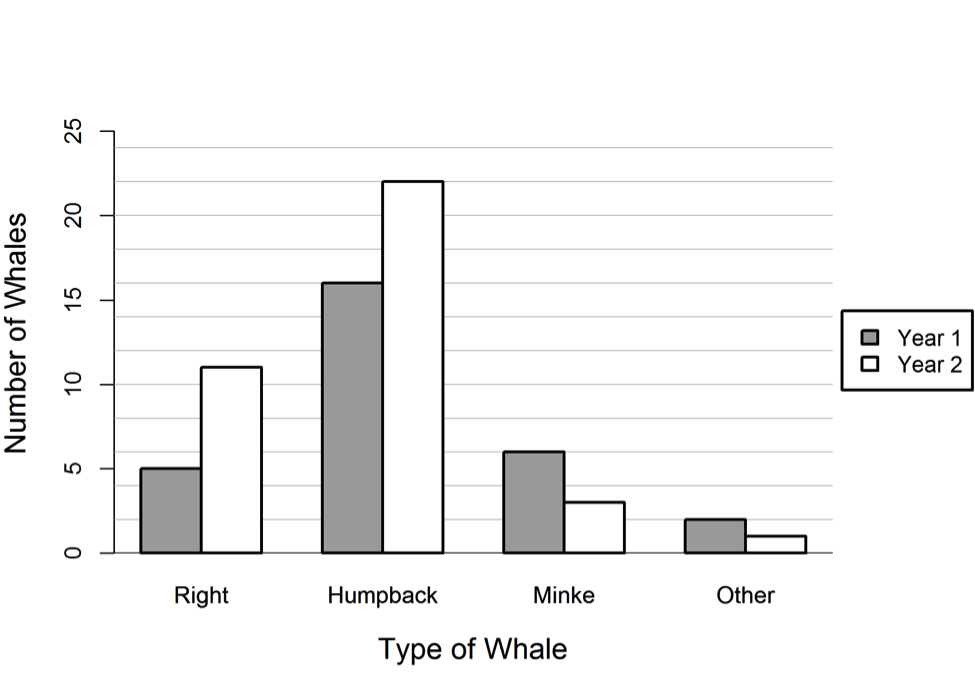
Whales often get entangled in fishing nets. The bar graph below gives the reported number of whales entangled in nets off the coasts of North America for two consecutive years.
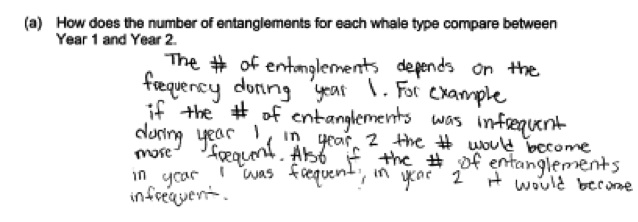
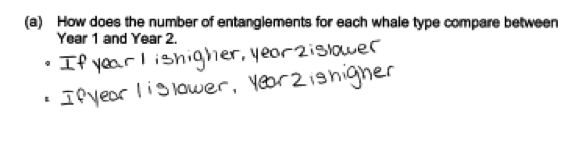
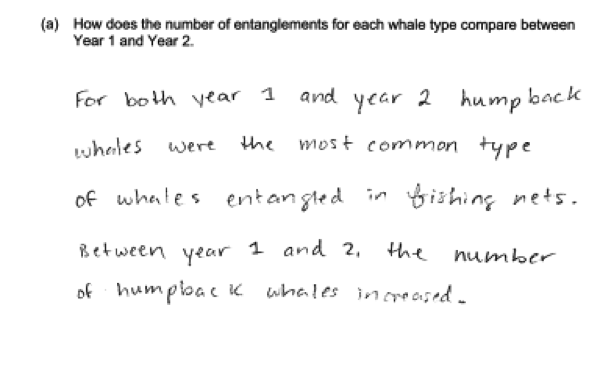
 (a) How does the number of entanglements for each whale type compare between Year 1 and Year 2.
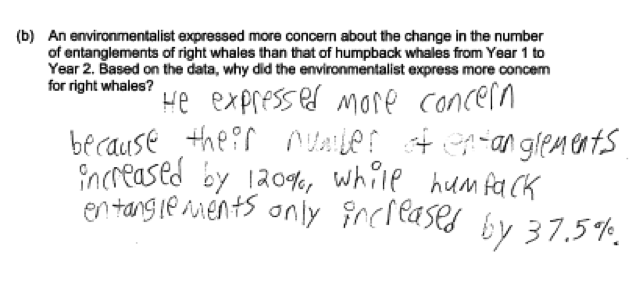
(b) An environmentalist expressed more concern about the change in the number of entanglements of right whales than that of humpback whales from Year 1 to Year 2. Based on the data, why did the environmentalist express more concern for right whales?
Overview of the question
This question is designed to assess the student’s ability to:
1. Describe change over time in the distribution of a categorical variable (part (a)).
2. Use proportional reasoning to assess relative change in category proportions (part (b)).
Ideal response and scoring
Part (a):
Part (a) asks students to compare two data distributions that have been displayed using a comparative bar graph. The comparative bar graph classified whales caught in fishing nets by type of whale in two different years. An ideal response to part (a) is one that provides a description of how the number of whales caught in fishing nets changed from one year to the next for each of the four types of whale.
Responses that do not address all the change for all types but do comment on the change for at least two types are considered to be partially correct. Responses that only comment on the change in the total number of whales of all types are also considered partially correct.
Part (b):
An ideal response to part (b) recognizes that the increase in the number of whales entangled is 6 for both right whales and humpback whales, but uses a proportional argument to explain that the environmentalist is more concerned about right whales because an increase of 6 for this group represents a larger percentage increase from one year to the next (a 120% increase versus a 37.5% increase). Students did not need to calculate percent change and could justify their answer by appealing to the bar graphs. However, if calculations are provided and they are incorrect, the response is considered only partially correct.
Responses that makes comparisons based on actual counts and that does not include a proportional argument are considered partially correct.
Sample responses indicating solid understanding
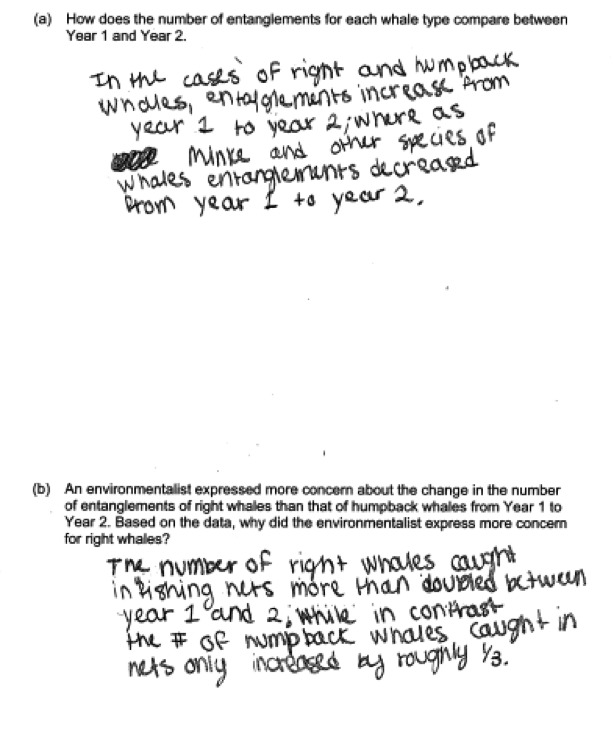
The following student response shows a good understanding of the concepts assessed by this question and received a score of 4. In part (a) the response includes a description of the change from year 1 to year 2 for each of the four different types of whale.
The response in part (b) uses a proportional argument in the comparison of the changes for right and humpback whales (“more than doubled” compared to “only increased by roughly 1/3”).
 Below is a second example of a student response that also received a score of 4. In part (a), each type of whale is addressed in a separate statement and the change from year 1 to year 2 is described. In part (b), the proportional argument appears in the last sentence, and this response was considered essentially correct for both parts (a) and (b).
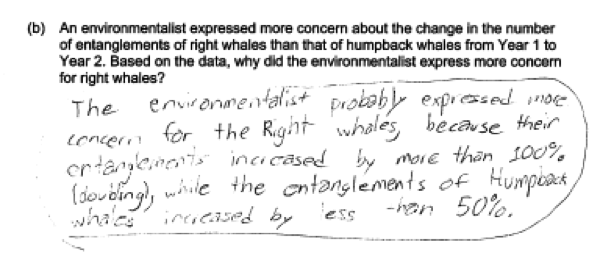
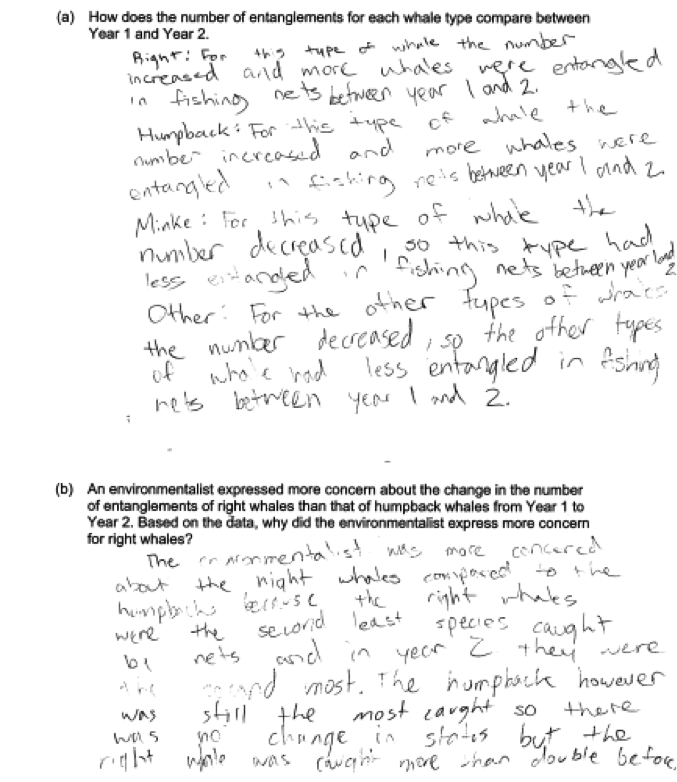 In part (b) there were a number of acceptable ways to appeal to a proportional argument. This is illustrated in the two responses below, both of which were scored as essentially correct for part (b). In the first response the student estimates percent change based on the bar graphs, whereas in the second response, the student actually calculates the percent changes.
Common misunderstandings
Part (a) Describe change over time in the distribution of a categorical variable
Most student responses to part (a) appropriately addressed the changes from year 1 to year 2 for each type of whale. Responses that were not considered essentially correct on part (a) generally made one of two errors. Some did not provide a description of the change from year 1 to year 2 that included all four whale types, and this was the most common student error. Others did not reason correctly about the given graph.
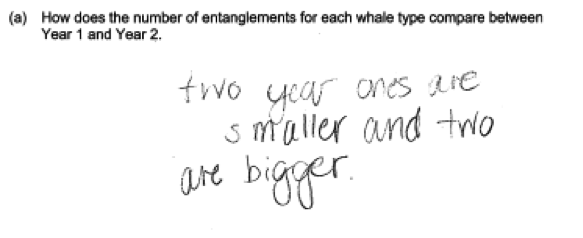
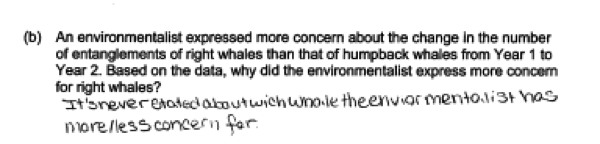
The following two student responses illustrate incorrect reasoning about the given graph. In the first response, the student is trying to describe an association between the year 1 numbers and the year two numbers, and does not specifically address the question asked. In the second response, the student does not use the given data to answer the question posed, and answers with a statement that is always true!
The most common mistake in part (a) was failure to address all four whale types in the response. This is illustrated in the following student response, which only describes the change for humpback whales.
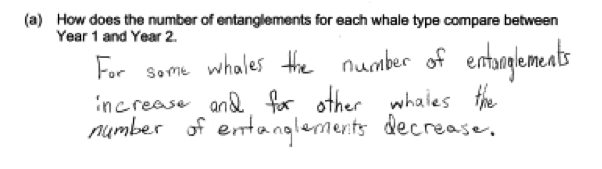
 Some responses did not clearly communicate the changes for the different whale types. The two student responses below indicate that some increased from year 1 to year 2 and some decreased, but do not relate these changes to specific whale types.
Part (b) Use proportional reasoning to assess relative change in category proportions
In part (b) the two most common errors were either failure to make a comparison between the change for right whales and the change for humpback whales or making an incorrect comparison between the two.
The following student responses were scored as only partially correct for part (b) because they described the change for right whales in terms of percent increase, but did not indicate that this change was greater than the percent change for humpback whales.
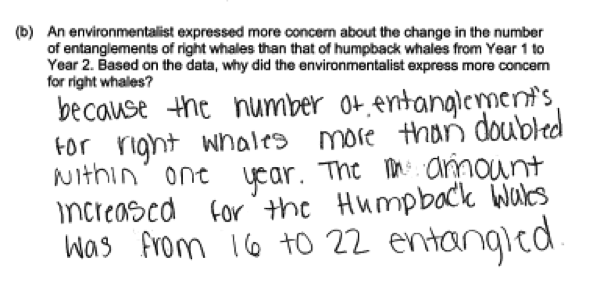
 The following student response was scored as only partially correct for part (b) because while a proportional argument is attempted, a proportional change for right whales is compared to an absolute change for humpback whales.
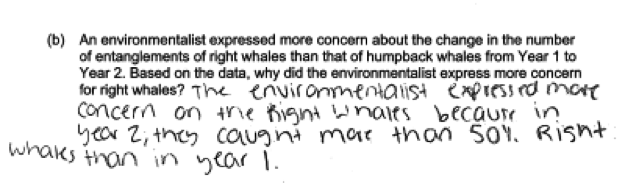
 Some responses used incorrect calculations in the answers to part (b). For example, in the following student response, the change for right whales is described as “more than 50%,” which is quite far off from the actual percent change of 120%. It also fails to make a comparison to the relative change for humpback whales.
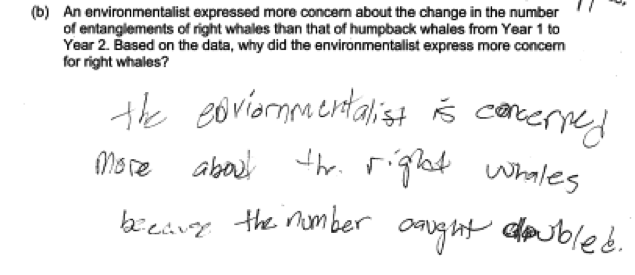
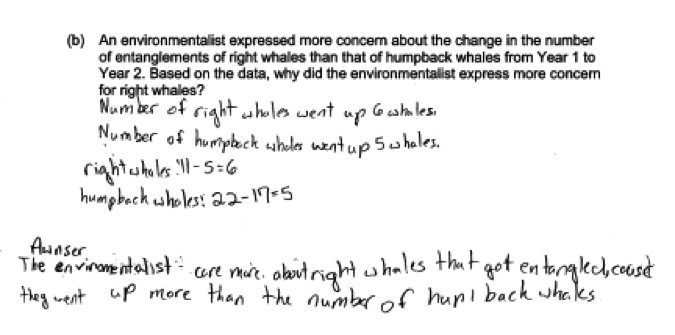
 A number of students did not make a proportional argument in responding to part (b), or did not communicate proportional reasoning clearly. For example, the following student response was scored as partially correct for part (b) because the proportional reasoning is not clearly communicated in the response.
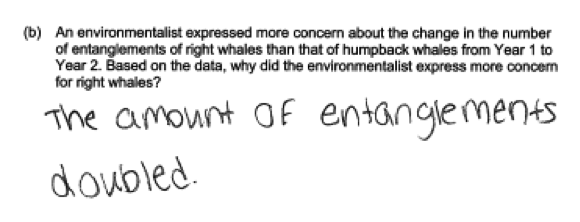
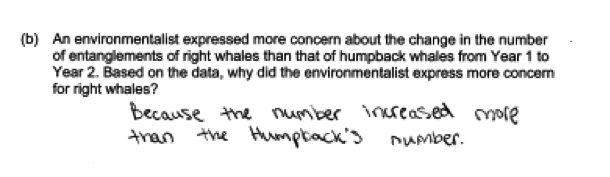
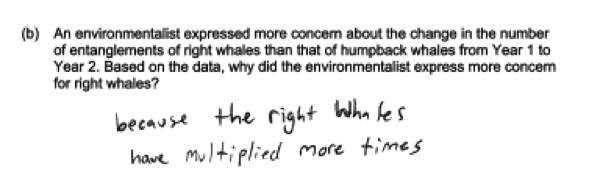 The following three student responses illustrate failure to use a proportional argument in the answer to part (b).
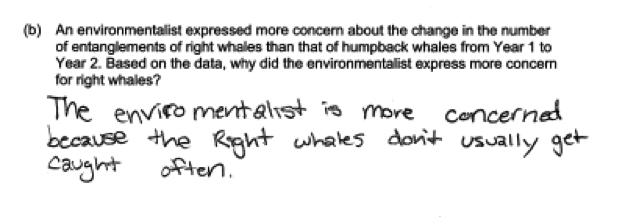
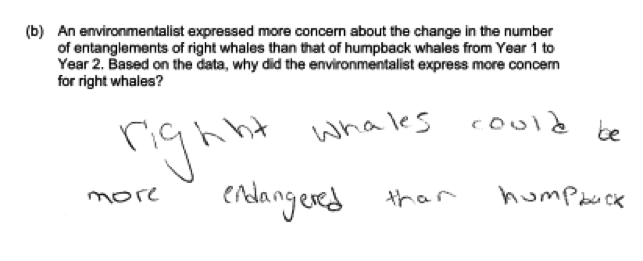
 Finally, some students did not use the given data and bar graph in their response to part (b). The following two student responses illustrate this mistake and each was scored as incorrect for part (b).
Student performance
Resources
Free Resources
Guidelines for Assessment and Instruction in Statistics Education (GAISE)
Published by the American statistical Association and freely available online, this document contains a discussion of using bar graphs to compare two groups on pages 38 – 39.