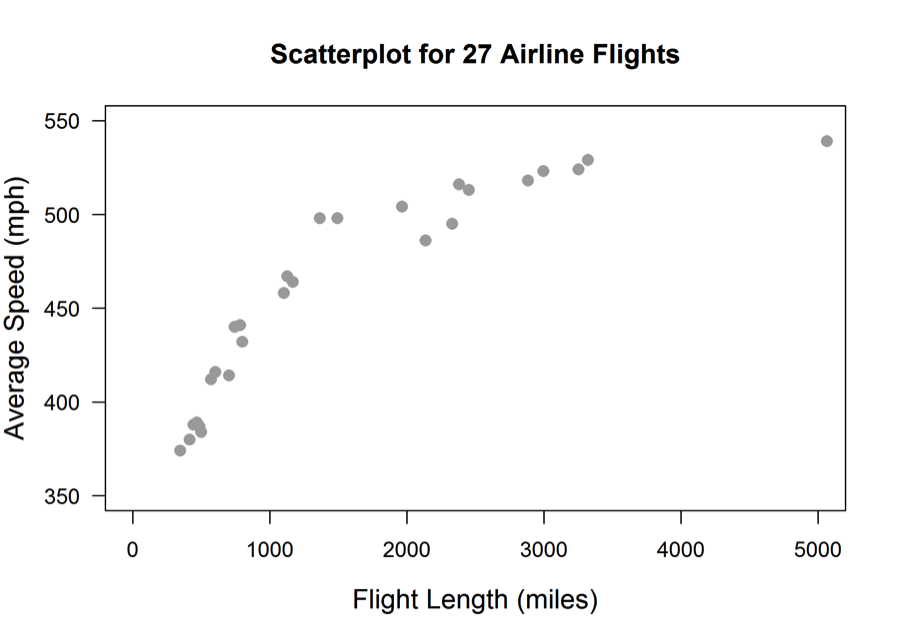
The average mean speed in miles per hour and length of flight in miles were recorded for 27 airline flights. The scatterplot of these data is shown below.
Which of the following best describes the relationship between flight length and average speed?
(A) There is a linear relationship between flight length and speed.
(B) There is a non-linear relationship between flight length and speed.
(C) There is no apparent relationship between flight length and speed.
(D) There is a relationship because speed tends to decrease as flight length increases.
Standards
8.SP.1: Construct and interpret scatter plots for bivariate measurement data to investigate patterns of association between two quantities. Describe patterns such as clustering, outliers, positive or negative association, linear association, and nonlinear association.
S-ID.6: Represent data on two quantitative variables on a scatter plot, and describe how the variables are related. a) Fit a function to the data; use functions fitted to data to solve problems in the context of the data. Use given functions or choose a function suggested by the context. Emphasize linear and exponential models; b) Informally assess the fit of a function by plotting and analyzing residuals; c) Fit a linear function for a scatter plot that suggests a linear association.
Correct answer and commentary
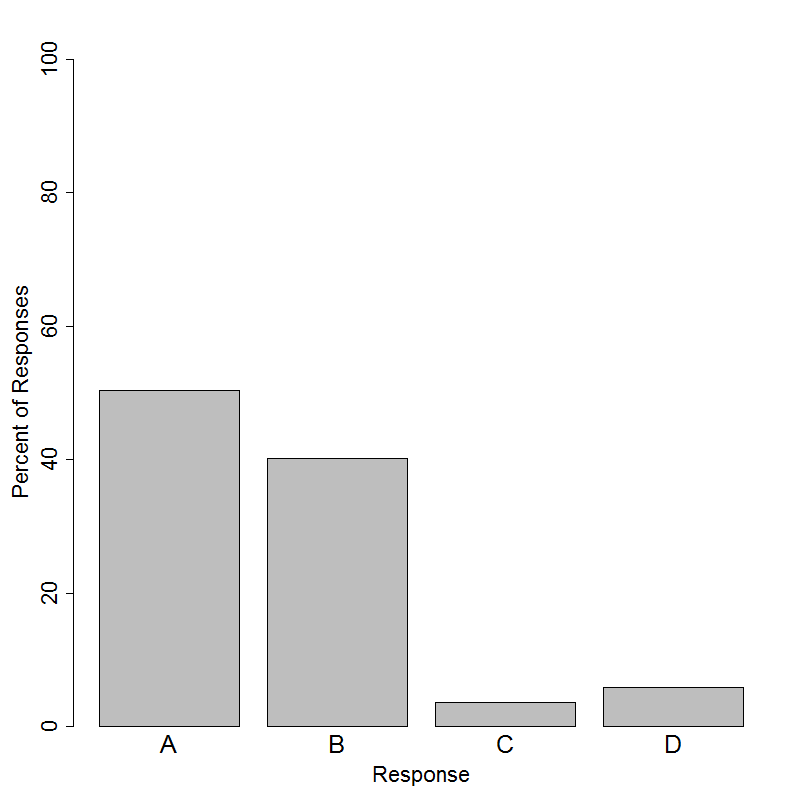
Student performance
The correct answer for this question is Option (B). The question asks students to read a scatterplot and describe the relationship between two quantitative variables – flight length and average speed. Clearly, there is a positive relationship between flight length and average speed; that is, as flight length increases, average speed tends to increase as well. However, this relationship is not linear, because the increase in speed is not proportional to the increase in flight length. Rather, a certain increase in flight length at the lower end of the scale is associated with a relatively large increase in speed, while the same increase in flight length at upper end of the scale is associated with a more modest speed increase. Thus, the relationship between flight length and average speed is nonlinear.
The most popular answer choice for this question was an incorrect answer - Option (A). Suppose that a linear function was fit to these data. The correlation coefficient would be moderately high, because the points would all fall fairly close to the line, but it is important to remember that a correlation coefficient is not sufficient to assess the fit of a function. On the other hand, a residual plot would serve to highlight the linear model’s lack of fit. The residual plot would show a curved pattern, indicating that the linear model consistently overestimates speed for some values of flight length and consistently underestimates for others.