A researcher wanted to know whether there is an association between gender and preference for a male or female boss when a person starts a new job. The researcher randomly sampled 1,000 employed adults living in City A. Each person was asked, “If you were to start a new job, would you prefer to have a male boss or a female boss?” The table below shows the results for City A.
CITY A
| Prefer Male Boss | Prefer Female Boss | Total | |
| Male | 428 | 122 | 550 |
| Female | 272 | 178 | 450 |
| Total | 700 | 300 | 1000 |
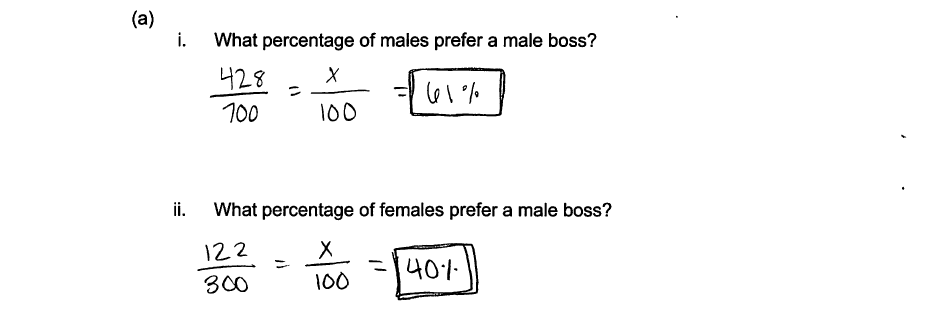
(a) (i) What percentage of males prefer a male boss?
(ii) What percentage of females prefer a male boss?
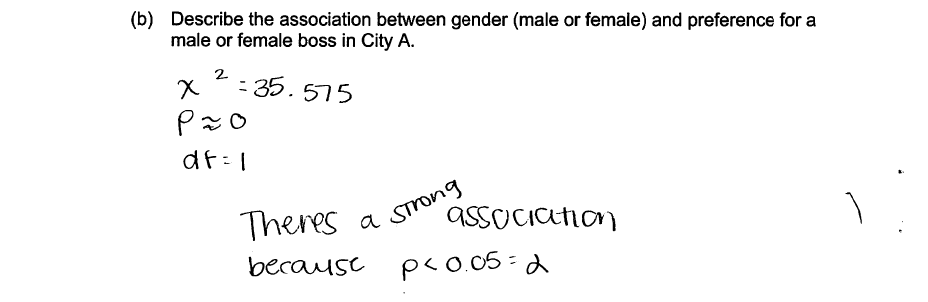
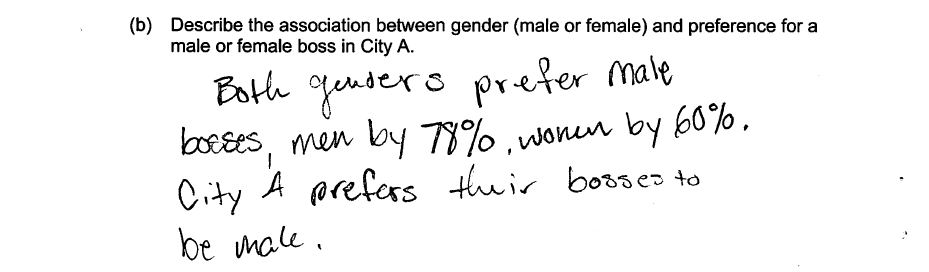
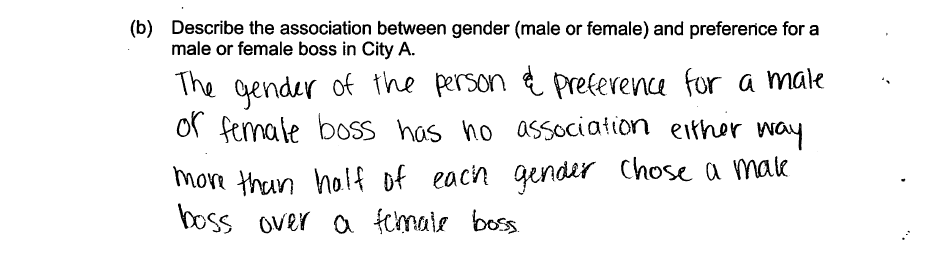
(b) Describe the association between gender (male or female) and preference for a male or female boss in City A.
The researcher asked the same question in a survey of 1000 randomly selected adults from City B. The table below shows the results for City B.
CITY B
| Prefer Male Boss | Prefer Female Boss | Total | |
| Male | 425 | 175 | 600 |
| Female | 275 | 125 | 400 |
| Total | 700 | 300 | 1000 |
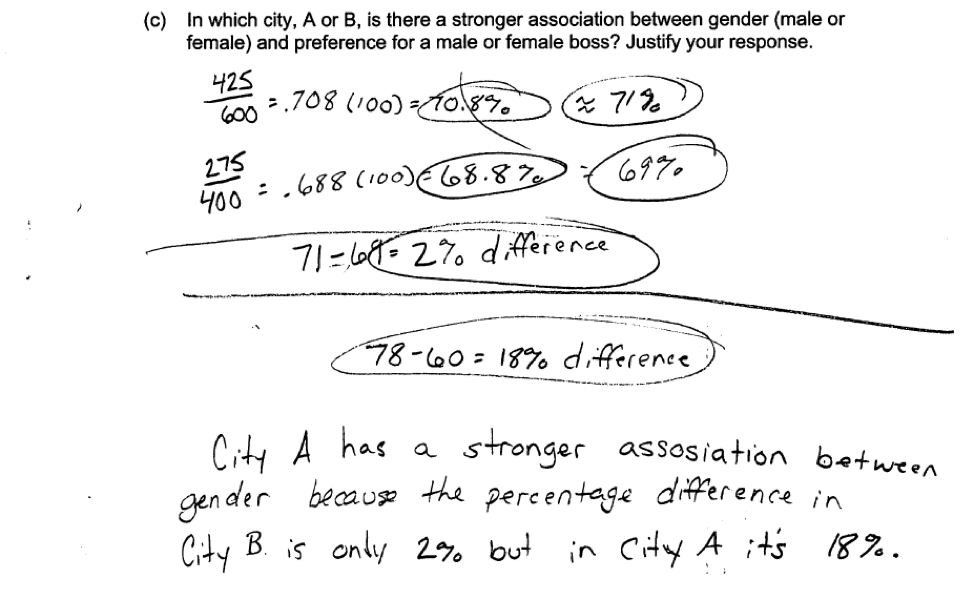
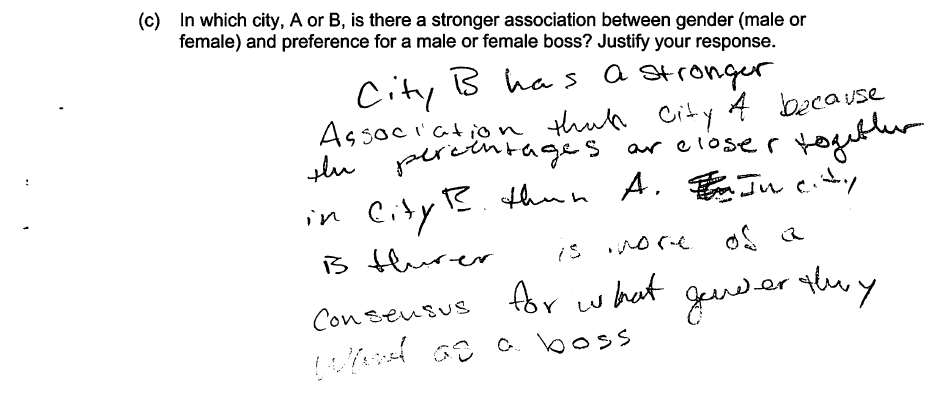
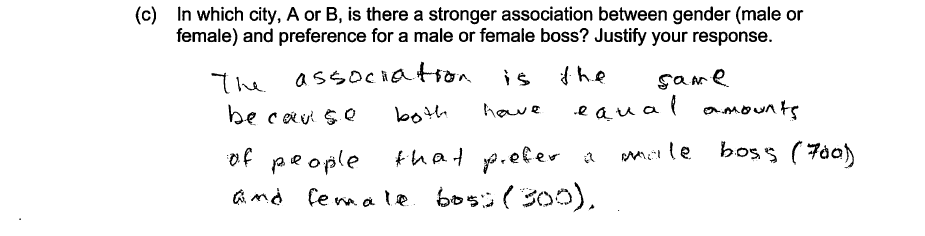
(c) In which city, A or B, is there a stronger association between gender (male or female) and preference for a male or female boss? Justify your response.
Overview of the question
This question is designed to assess the student’s ability to:
1. Calculate conditional percentages (conditional relative frequencies) from a 2-way table (part (a)).
2. Use conditional percentages to describe an association between two variables (part (b)).
3. Use conditional percentages to compare the strength of the association between two variables for two different groups (part (c)).
Standards
8.SP.4: Understand that patterns of association can also be seen in bivariate categorical data by displaying frequencies and relative frequencies in a two-way table. Construct and interpret a two-way table summarizing data on two categorical variables collected from the same subjects. Use relative frequencies calculated for rows or columns to describe possible association between the two variables.
S-ID.5: Summarize categorical data for two categories in two-way frequency tables. Interpret relative frequencies in the context of the data (including joint, marginal, and conditional relative frequencies). Recognize possible associations and trends in the data.
Ideal response and scoring
Parts (a) and (b) were combined in the scoring of this item.
An ideal response to part (a) gives the correct percentage of males that prefer a male boss and the correct percentage of females that prefer a male boss. From the table, out of the 550 males, 428, or 77.08% prefer a male boss and out of the 450 females, 272, or 60.4% prefer a male boss. There was no penalty for rounding errors or other minor computational errors in calculating the conditional percentages.
An ideal response to part (b) states that males are more likely than females to prefer a male boss, noting that of the males, 78% prefer a male boss, whereas among the females only 60% prefer a male boss. Simply stating that both genders prefer a male boss is not sufficient for a score of essentially correct on part (b) because the percentage for males was not compared to the percentage for females.
Responses to parts (a) and (b) that contain only correct calculations for part (a) OR only a correct comparison of male and female conditional percentages were considered as partially correct for the combine parts (a) and (b).
Part (c):
For City B, the percentage of males that prefer a male boss is about 71% and the percentage of females that prefer a female boss is about 69%. An ideal response to part (c) correctly calculates these conditional percentages and states there is a stronger association between gender and preference for a male or female boss in City A because the difference in percentages who prefer a male boss for males and females is much larger in City A than in City B (18% vs. 2%). To be considered essentially correct for part (c), a response must include correct calculations of conditional percentages, a statement that the association is stronger for City A, and an explanation that is based on a comparison of the difference in conditional percentages for City A and City B. (Note that because the City A sample size and the city B sample size were equal, it was also possible to justify the choice of City A based on the value of a chi-squared statistic. Although this was not something that students were expected to be familiar with, a few students did take this approach and it was considered to be a reasonable basis for comparison in part (c).)
Responses that include only two of these three components were considered partially correct for part (c). Response that include only one or none of these three components were scored as incorrect for part (c). Instead of comparing appropriate percentages, the response may use chi-squared calculations to compare the two cities.
Sample responses indicating solid understanding
The following student response shows a good understanding of the concepts assessed by this question and received a score of 4. The conditional percentage of males that prefer a male boss and the conditional percentage of females that prefer a male boss are correctly calculated in part (a). In part (b) the student makes a correct comparison of the conditional percentages, stating that while both genders prefer male bosses, more males (based on percentages) prefer a male boss. Since both correct calculations and a correct comparison were present, parts (a) and (b) were scored essentially correct. In part (c), the student correctly calculates the appropriate conditional percentages for City B, states that City A has the stronger association, and justifies this conclusion by comparing the differences in conditional percentages for City A and City B. With all three components of part (c) correctly completed, this response received an essentially correct for part (c). With both the combined parts (a) and (b) and part (c) scored as essentially correct, this response received a score of 4.

 The following student response illustrates the use of the chi-square statistic to make the comparison in part (c). City A is chosen as having a stronger association, the correct chi-squared values are provided, and an appropriate comparison between City A and City B is made. This response was considered to be essentially correct for part (c). (Note that this response was not considered to be essentially correct for the combined parts (a) and (b) because the response to part (b) did not include a description of the association.)

Common misunderstandings
Part (a)
Calculate conditional percentages (conditional relative frequencies) from a 2-way table.
Many students were able to correctly calculate the conditional percentages. However, some students were unable to identify which rows and columns should be used in the calculation. In the following example, the student uses the preference column instead of the gender column as the denominator in the calculation of the conditional percentages.
Part (b)
Use conditional percentages to describe an association between two variables.
While many students were able to correctly calculate the correct conditional percentages in part (a), some were unable to use this information to make a valid statement about the association between the two variables in question, gender and preference for boss’ gender. For example, the following response states that both genders prefer male bosses. While this is true, it does not describe an association between the two variables because it only describes the preference for boss gender and does not comment on the difference in conditional percentages.
The following response makes the claim that there is no association between the gender of the person and their preference for a male or female boss. This response might have been considered correct if the student had claimed that the 18 percentage point difference in part (a) is not large enough to convince them that there is an association. However, simply stating that more than half of each gender prefers a male boss over a female boss is not evidence that there is no association.
Part (c)
Use conditional percentages to compare the strength of the association between two variables for two different groups.
In responding to part (c), Some students appeared to be on the right track, and knew to look at the differences in conditional percentages for male and female preferences for male bosses in each of the two cities. However, they incorrectly concluded that City B has a stronger association because the percentages are closer together in City B than in City A. The percentages being closer together means that the preference for a boss of a particular gender is not very different for males and females, indicating that there is not a strong association between the two variables.
Other students responded that the association is the same in City A and in City B. These responses concluded that since the conditional percentages in both cities looked similar, the associations must also be the same.

Another error in student reasoning is illustrated in the following student response. In this response, the student concludes that the association is the same for the two cities, basing this conclusion on marginal percentages rather than on conditional percentages.
 Students familiar with significance tests who responded based on a comparison of the value of a chi-square statistic also ran into some problems interpreting their calculations. For example, the following response correctly calculated the chi-square statistics and p-values for the two cities. The student correctly states that the p-values imply rejecting the null hypothesis of no association (or equal conditional percentages) for City A and failing to reject the null hypothesis for City B. However, this line of reasoning leads to the conclusion that there is evidence of an association for City A but no evidence of an association for City B, which would indicate that the association is stronger for City A. The response incorrectly indicates that City B has the stronger association.

Student performance

Resources
More information about this topic can be found in the following resources.
Free Resources
Lessons
Statistics Education on the Web (STEW) has peer reviewed lessons plans. Some lessons related to the topic of this question are:
I Always Feel Like Somebody's Watching Me
The Case of the Careless Zookeeper
Applets
The Rossman/Chance Applet Collection has an applet for Analyzing Two-Way Tables using both the Chi-Squared test and a randomization-based approach. This applet is related to the content of this item but does so at a more advanced level.
Classroom and Assessment Tasks
Illustrative Mathematics has peer reviewed tasks that are indexed by Common Core Standard. Two tasks relevant to the concepts assessed in this Locus question are:
S-IC, S-ID Musical Preferences
Support for a Longer School Day?
Guidelines for Assessment and Instruction in Statistics Education (GAISE)
Published by the American Statistical Association, this document contains a discussion on two-way frequency tables and association between categorical variables on pages 40 & 95 – 98.
Resources from the American Statistical Association
Bridging the Gap Between Common Core State Standards and Teaching Statistics is a collection of investigations suitable for classroom use. This book covers association between two categorical variables in Investigation 4.4, “Can You Roll Your Tongue?” p.153-162. This investigation is available as the free sample lesson for the book.
Making Sense of Statistical Studies is a collection of investigations suitable for classroom use. Association between categorical variables in explored in Investigation 8 p.87-94, Investigation 12 p.138-144, and Investigation 15 p.166-181.
Resources from the National Council of Teachers of Mathematics
The NCTM publication Statistical Questions from the Classroom discusses association and independence on p.29-33.
The NCTM publication Developing Essential Understanding of Statistics in Grades 6 – 8 includes a section on the big idea “Associations between Two Variables.” See the discussion on pages 51 – 56.
The NCTM publication Navigating through Data Analysis in Grades 9 – 12 includes a chapter titled “Making Decisions with Categorical Data” that contains information about concepts assessed in this question.