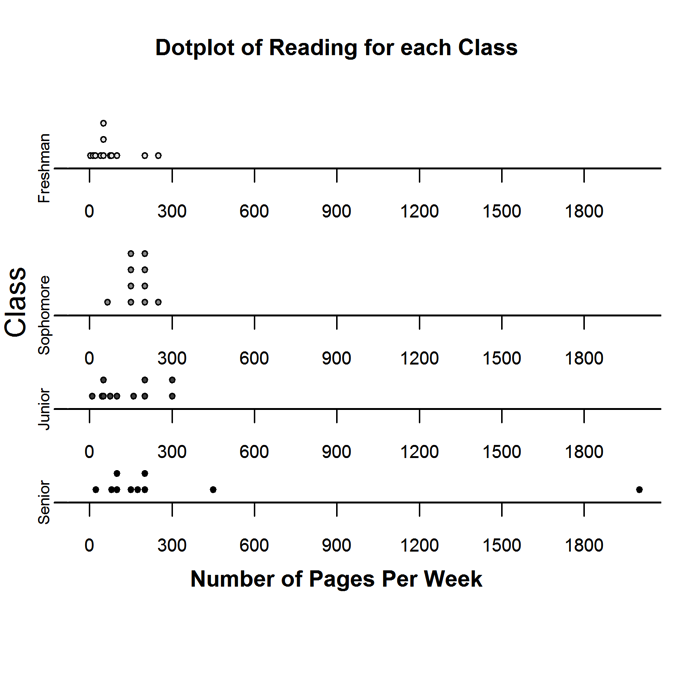
The dotplots below show the amount of reading (in pages per week) that a sample of high school students expect to complete during a semester.
Which class has the least variability in pages read per week?
(A) Freshman
(B) Sophomore
(C) Junior
(D) Senior
Standards
6.SP.2: Understand that a set of data collected to answer a statistical question has a distribution which can be described by its center, spread, and overall shape.
6.SP.5c: Summarize numerical data sets in relation to their context, such as by: Giving quantitative measures of center (median and/or mean) and variability (interquartile range and/or mean absolute deviation), as well as describing any overall pattern and any striking deviations from the overall pattern with reference to the context in which the data were gathered.
S-ID.3: Interpret differences in shape, center, and spread in the context of the data sets, accounting for possible effects of extreme data points (outliers).
Correct answer and commentary
Student performance
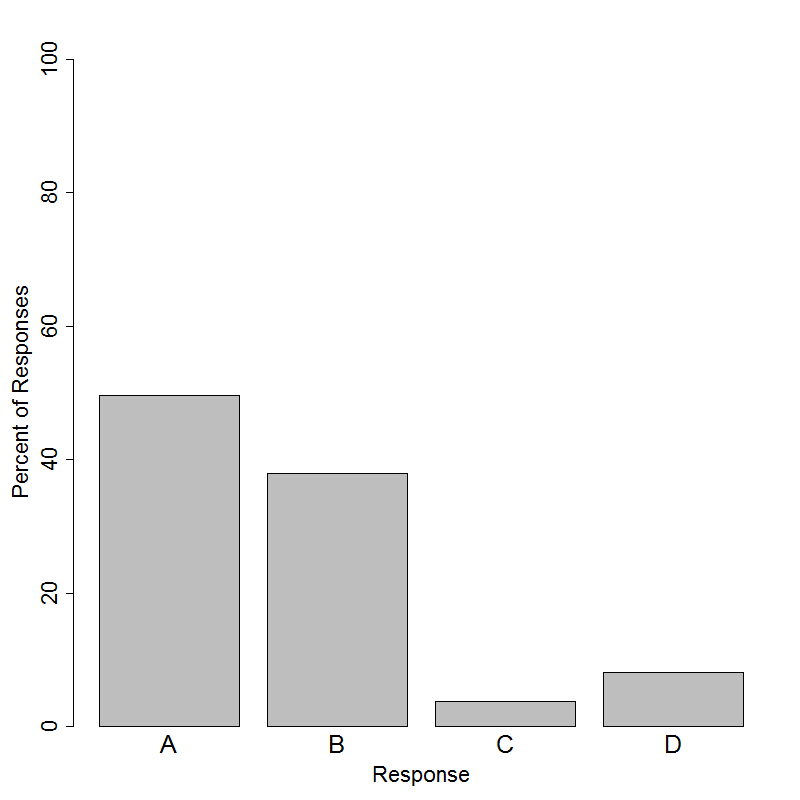
The correct answer to this question is Option (B). This question asks students to choose from among four dotplots the one with the least variability in the expected number of pages read in a week. No calculations are needed to answer this question; informally (visually) assessing the variability in a display is an important skill for students to learn.
The class with the most variability is readily apparent: Seniors. Even excluding the student who read 2000 pages per week (an outlier), the Senior class has the greatest variability because its data are most spread out. A quick glance suggests that the Freshmen and Sophomore classes are the two groups with the lowest variability, because their data are the most clumped together. But which of these has the least variability?
Many students incorrectly chose the Freshmen class as having the least variability. It is important to remember that variability is often measured by determining how far points are, on average, from their mean, e.g., the standard deviation and mean absolute deviation (MAD). The Sophomore class has eight observations that are visually close to this group’s mean, with half of the observations on either side of the mean. The Freshmen class does not exhibit as many points about its mean, and the two larger observations are relatively far from the mean. Thus, there is increased variability, relative to the Sophomores’ variability and so the Sophomore class has the least variability of the four classes.
The effect of observations that are (relatively) far from the mean on the variability of a dataset is important to understand. The tight grouping of many points in the Freshmen class suggests that the mean is low. Therefore, even though many of the points are tightly grouped and on their own would have low variability the two larger points increase the variability. Correctly answering this question requires students to first visually estimate the mean and then to assess the variability of points with respect to their estimate.