Question:
A university consists of six colleges. Each student at the university has chosen to enroll in one of these colleges. The graph below shows the distribution of college choice.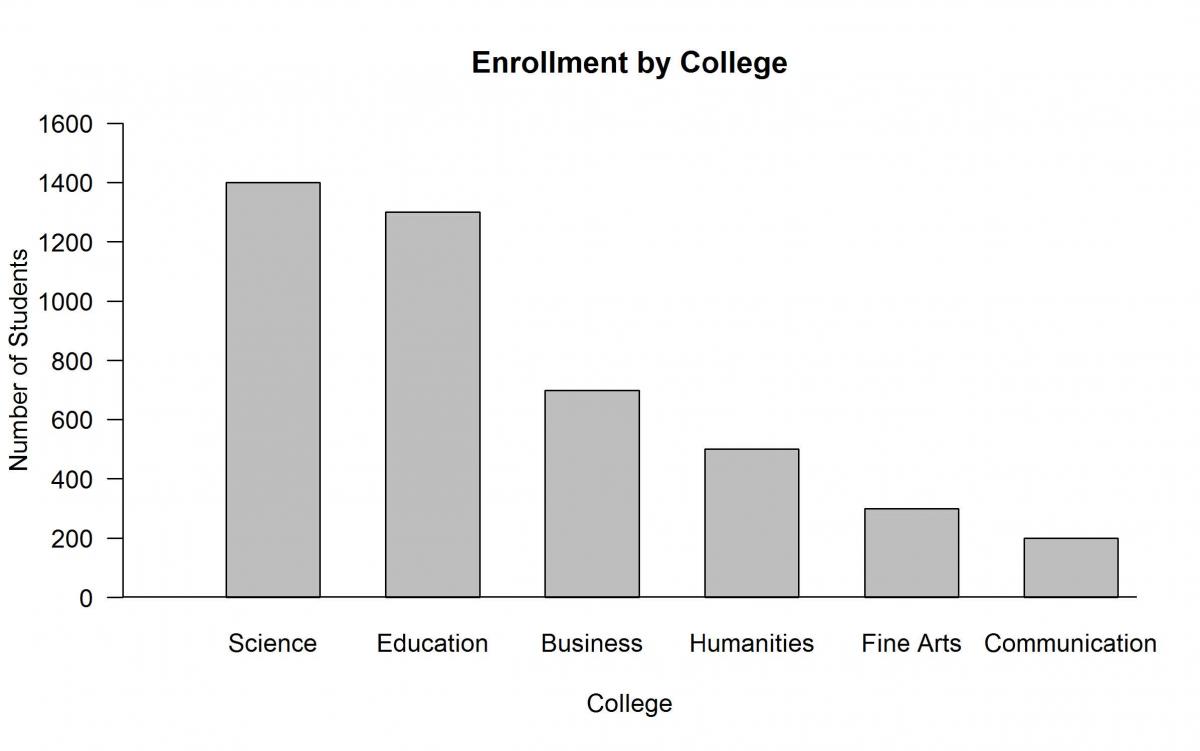
Which of the following statements is correct?
(A) The distribution is skewed to the left (negatively skewed).
(B) The distribution is skewed to the right (positively skewed).
(C) The majority of students are enrolled in the college of science.
(D) After science and education, there is a large drop in enrollments for the other colleges.
Level:
Intermediate
Standards
6.SP.2: Understand that a set of data collected to answer a statistical question has a distribution which can be described by its center, spread, and overall shape.
Correct answer and commentary
Student performance
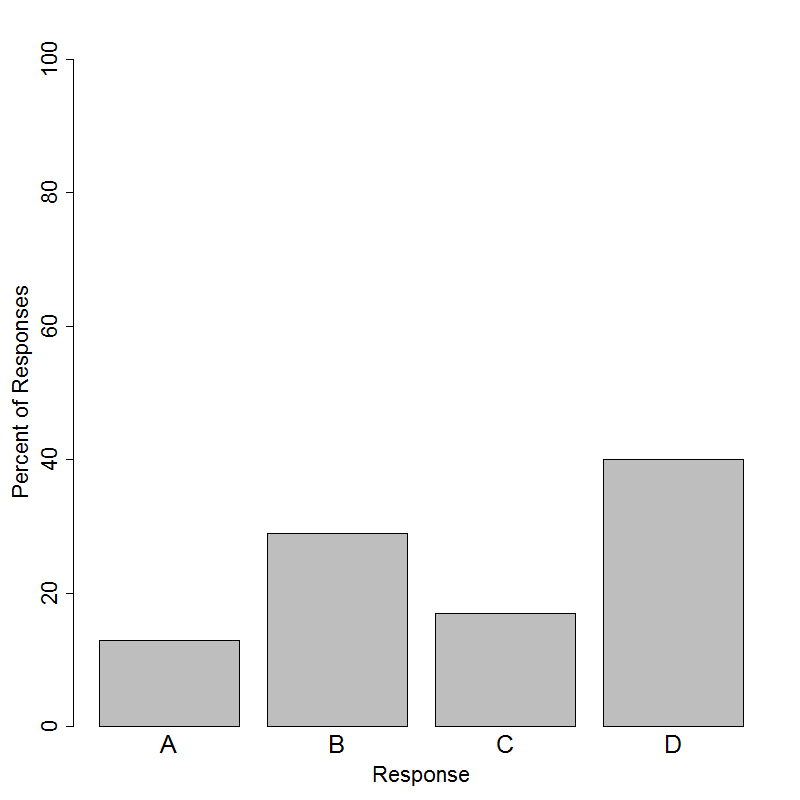
The correct answer to this question is Option (D). The bar graph is arranged from greatest enrollment to least enrollment - a common and appropriate display technique - and shows that the science and education colleges include considerably more students than any other. The correct answer choice represents a fairly straightforward interpretation of this display of categorical data, yet only 40% of students chose (D), so we should pay particular attention to the misunderstandings addressed by the incorrect answer choices.
Options (A) and (B) both refer to the “shape” of this distribution of categorical data. Students should understand that a distribution of numerical data can be described in terms center, spread, and shape; but they must also understand that these descriptors are not appropriate for all data. In this context, the variable college is categorical, and the values science, education, business, etc. do not have a natural ordering. For example, the colleges could be ordered alphabetically on the axis. Because the ordering of the categories is arbitrary, it does not make sense to refer to the “shape of the distribution” for a graphical representation of categorical data. Although the plot of the data may appear to be skewed a certain direction at first glance, Option (B) is incorrect because a distribution of categorical data does not have a shape. 13% of students answered (A) and 29% of students answered (B).
Option (C) represents a misunderstanding of the term majority. Although the science college includes more students than any other college, fewer than 50% of students are enrolled in the science college, so it should not be called a majority. 17% of students answered (C).