A citrus farmer grows two types of oranges: mandarin and navel. The distributions of weight for each type of orange grown on his farm are shown in the histograms below.
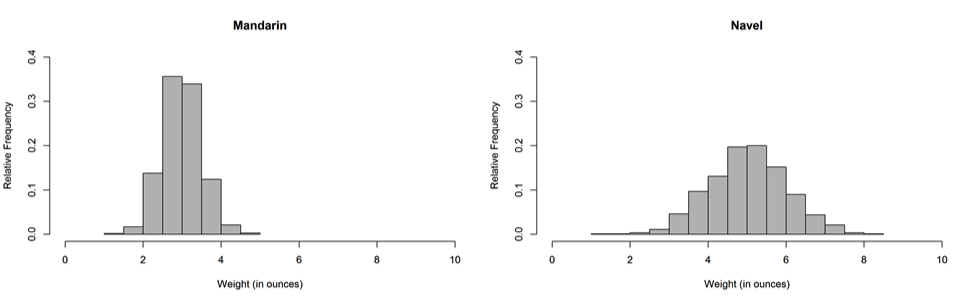
The farmer will select a random sample of 100 mandarin oranges and a random sample of 100 navel oranges. Which sample is more likely to produce a sample mean within 1 ounce of the mean weight for its population?
(A) The sample of mandarin oranges because the weights of mandarin oranges are less variable than the weights of navel oranges.
(B) The sample of navel oranges because the weights of navel oranges have a greater mean than the weights of mandarin oranges.
(C) Both samples are equally likely to produce a sample mean within 1 ounce because the sample sizes are the same.
(D) It is impossible to know which sample is more likely to produce a sample mean within 1 ounce without the actual data from the samples.
Standards
7.SP.2: Use data from a random sample to draw inferences about a population with an unknown characteristic of interest.
S-ID.2: Use statistics appropriate to the shape of the data distribution to compare center (median, mean) and spread (interquartile range, standard deviation) of two or more different data sets.
Correct answer and commentary
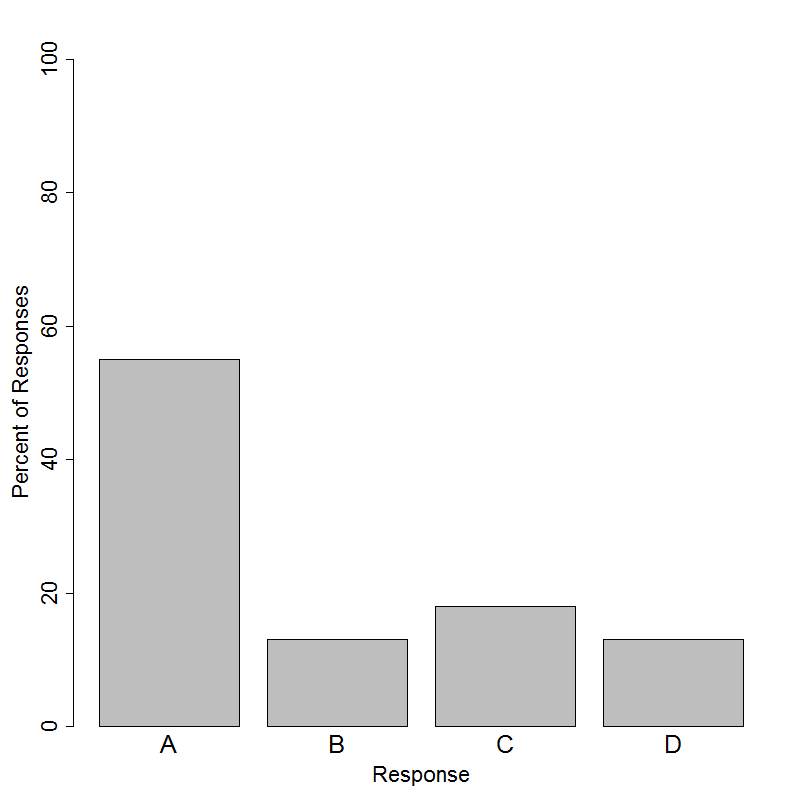
Student performance
This question addresses what happens when take samples from populations that have differing amounts of variability. The question specifically asks which of the two samples are more likely to produce a sample mean within 1 ounce of the mean weight for its population. A population with small variability is more likely to produce a sample with small variability than a population with large variability.
Looking at the options, option (B) states that the navel oranges are more likely to produce a sample mean within 1 ounce of the mean weight for its population because they have a greater mean than the weights of mandarin oranges. This option is only comparing means, and does not make any connections between the populations or sample variability. Option (C) is incorrect because how close a sample mean is to a population mean depends on both sample size AND the variability in the population. Option (D) is incorrect because it negates the usefulness of inference. We can use the data that we are given to make an educated guess that is more likely correct than it is incorrect. Option (A) correctly recognizes that less variability in the population implies that the sample mean is more likely to be closer to the population mean than a sample from a population with more variability.