People’s dominant hand is the one they usually use when they write. People also have a dominant eye. A class of seventh graders decided to investigate whether there is an association between eye dominance and hand dominance. They randomly sampled 100 seventh graders in their school, tested them for eye and hand dominance, and summarized the results in the table below.
| Eye Dominance | ||||
| Hand Dominance | Right | Left | Total | |
| Right | 54 | 26 | 80 | |
| Left | 6 | 14 | 20 | |
| Total | 60 | 40 | 100 |
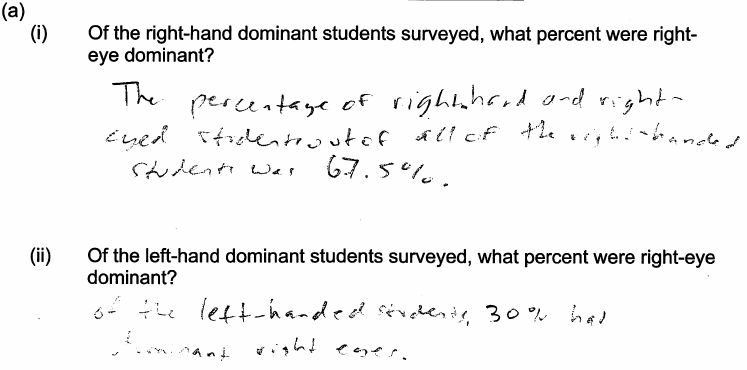
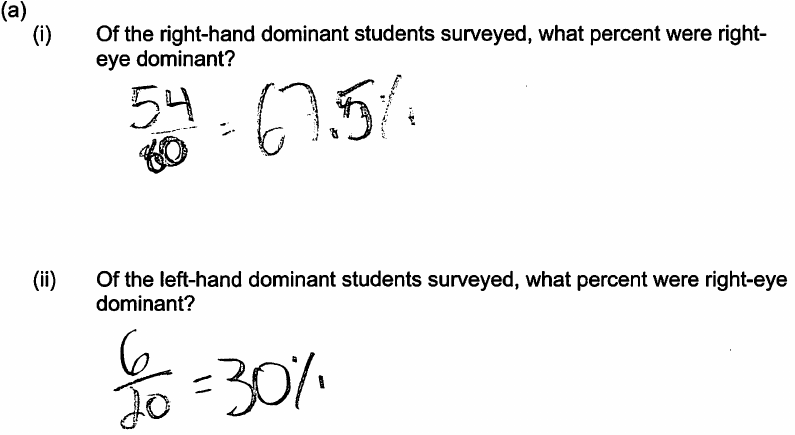
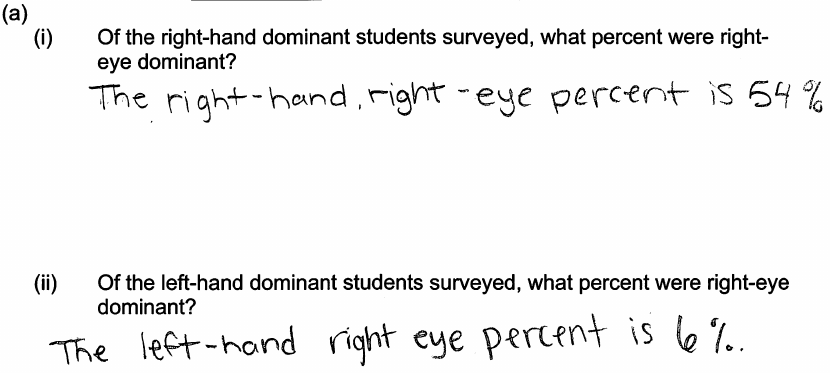
(a) (i) Of the right-hand dominant students surveyed, what percent were right-eye dominant?
(ii) Of the left-hand dominant students surveyed, what percent were right-eye dominant?
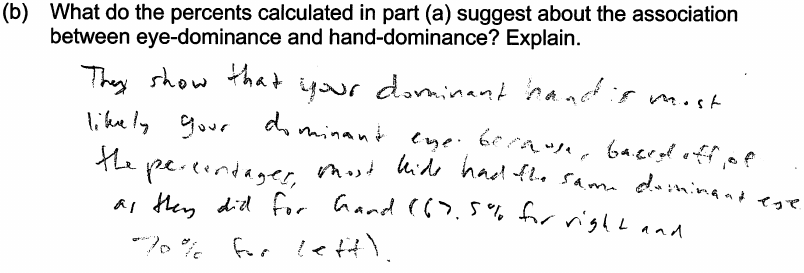
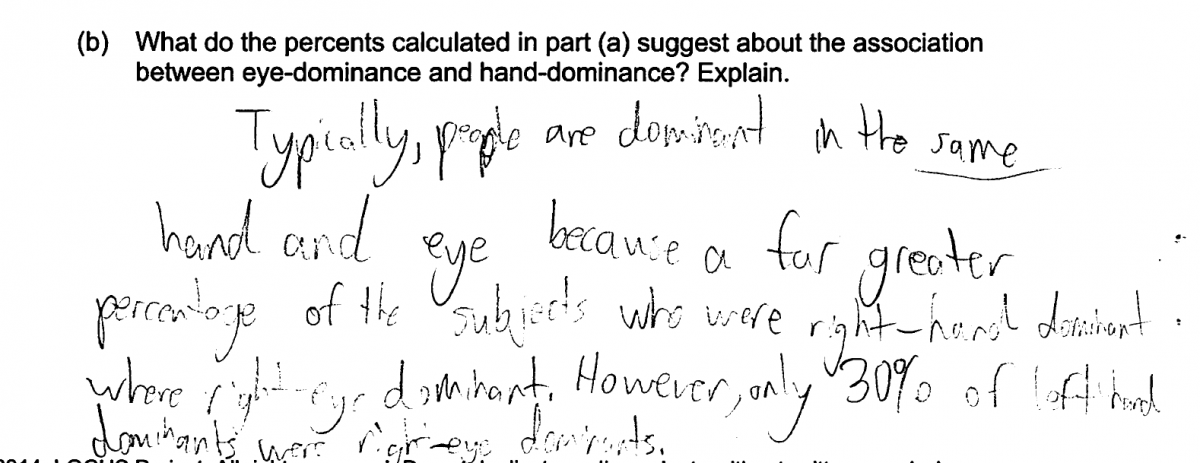
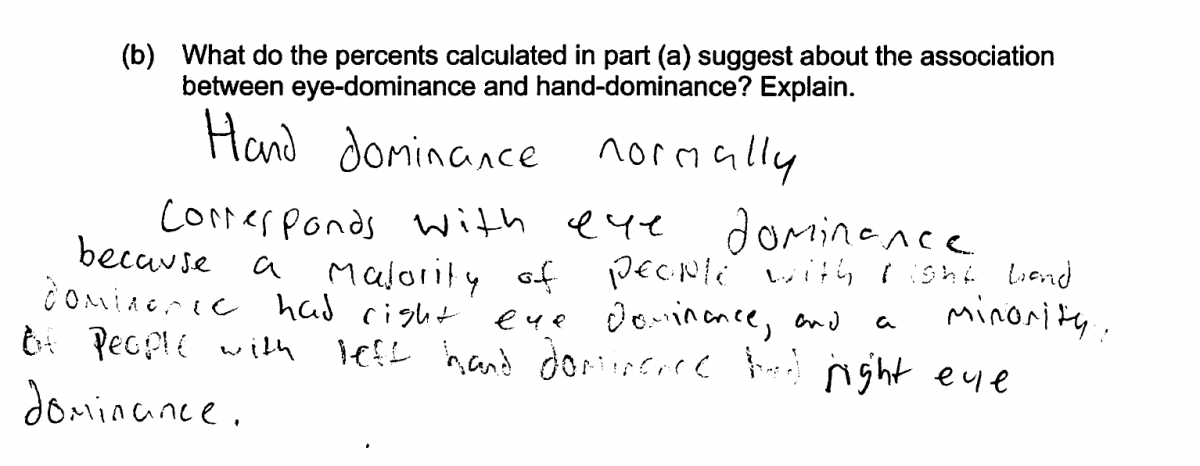
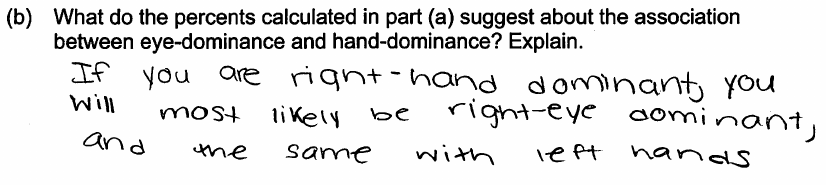
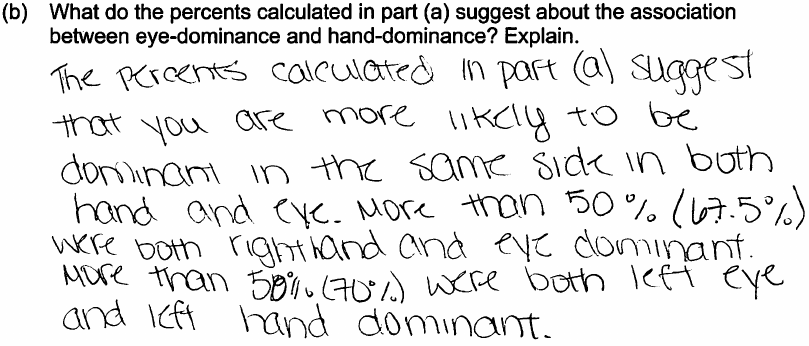
(b) What do the percents calculated in part (a) suggest about the association between eye-dominance and hand-dominance? Explain.
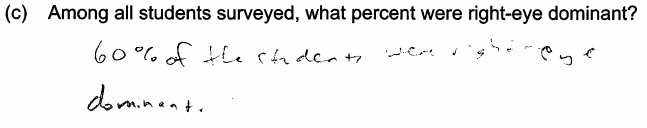
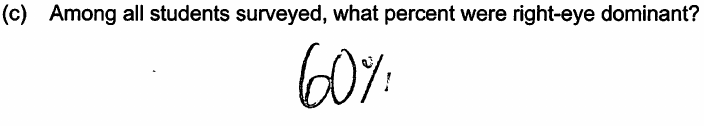
(c) Among all students surveyed, what percent were right-eye dominant?
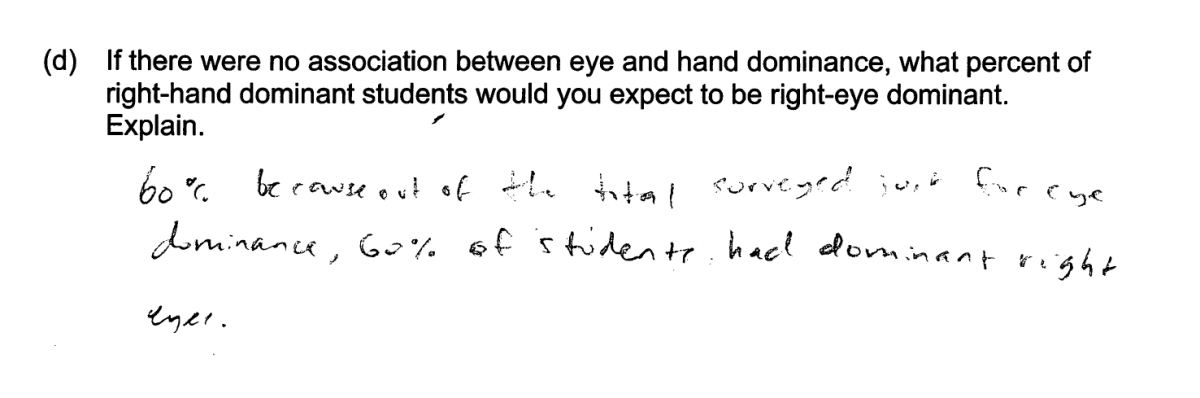
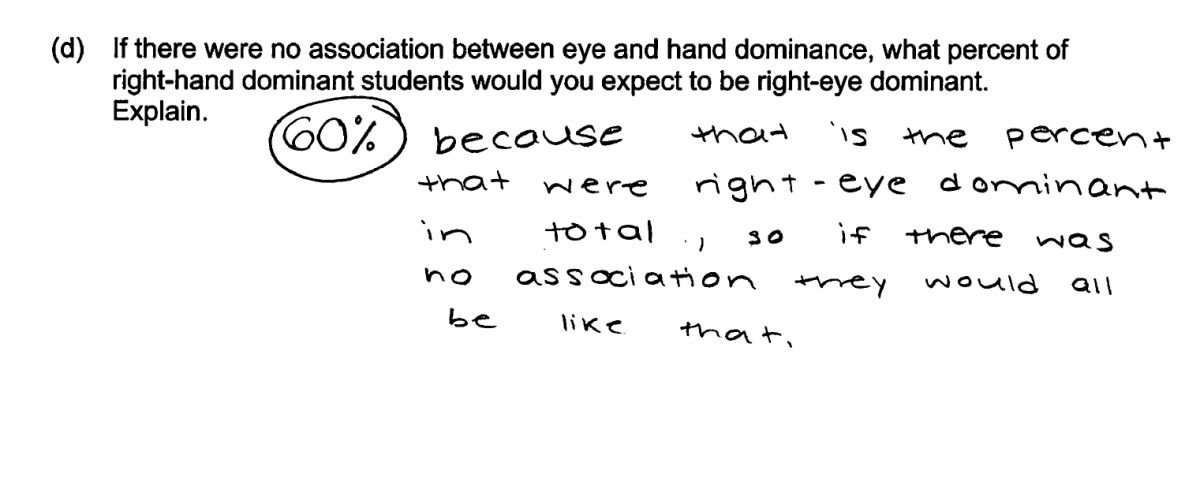
(d) If there were no association between eye and hand dominance, what percent of right-hand dominant students would you expect to be right-eye dominant. Explain.
Overview of the question
This question is designed to assess the student’s ability to:
1. Calculate marginal relative frequencies and conditional relative frequencies for a give two-way table (Parts (a) and (c)).
2. Determine if there is evidence of association between two categorical variables (Part (b)).
3. Identify the value of a row relative frequency that would be consistent with no association (Part (d)).
Standards
8.SP.4: Understand that patterns of association can also be seen in bivariate categorical data by displaying frequencies and relative frequencies in a two-way table. Construct and interpret a two-way table summarizing data on two categorical variables collected from the same subjects. Use relative frequencies calculated for rows or columns to describe possible association between the two variables.
Ideal response and scoring
Parts (a) and (c):
Parts (a) and (c) are combined for purposes of scoring the response.
An ideal response to part (a) indicates that 67.5% (54/80) right-hand dominant students surveyed were right-eye dominant and that 30% (6/20) of the left-hand dominant students surveyed were right-eye dominant. An ideal response to part (c) indicates that 60% (60/100) of all the students surveyed were right-eye dominant. A response is essentially correct if the calculations are correct in parts (a) and (c). A response is partially correct if the calculations are correct in only one of parts (a) or part (c).
Part (b):
An ideal response to part (b) indicates that the conditional percentages found in part (a) are very different which suggests and association between eye-dominance and hand-dominance. A response to part (b) is essentially correct if it contains a correct statement about the association between eye-dominance and hand-dominance based on an appropriate comparison between the calculated conditional percentages in part (a). A response that contains a correct statement about the association between eye-dominance and hand-dominance but for which the explanation is judged to be weak is considered to be only partially correct for part (b).
Part (d):
An ideal response to part (d) indicates that because 60% of the 7th graders were right-eyed, we would expect 60% of the right-handed students (or 48 of the 80) to be right-eyed if there were no association. A response to part (d) is essentially correct if it contains a clear indication that if there is no association, the percent of right-handed people who are right-eye dominant should be equal to the calculated value in part (c) and also includes a reasonable explanation. A response that contains a clear indication that if there is no association, the percent of right-handed people who are right-eye dominant should be equal to the calculated value in part (c) but for which the explanation is judged to be weak is considered to be only partially correct for part (d).
Sample responses indicating solid understanding
This question was designed to assess students’ understanding of the concept of association between two categorical variables. Parts (a) and (c) were included to help students answer parts (b) and (d), respectively. Because of the straightforward nature of scoring responses to computational problems, parts (a) and (c) were read and scored together.
This question asks students to reach a conclusion about association based on calculated conditional percentages (part (b)) and to describe what the data would be expected if there is no association between two categorical variables (part (d)).
For parts (a) and (c), students did not need to include verbal responses to demonstrate understanding; obtaining the correct numerical values for the conditional percentages and marginal percentages is evidence that the student understood which values to use from the two-way table. The following two responses include correct numerical values for both parts and were scored essentially correct for the combined parts (a) and (c).
An ideal response to part (b) includes both a correct statement about association and a strong justification based on the conditional percentages calculated in part (a). The following three student responses were all scored as essentially correct for part (b) because they conclude that there is evidence of an association and justify this conclusion using conditional percentages from part (a). In the third student response below, the references to majority and minority were sufficient for linkage to the conditional percentages of 67.5% (the majority) and 30% (a minority).
An ideal response to part (d) indicates that if there is no association between eye and hand dominance, the percent of right-hand dominant students that are also right-eye dominant is expected to be equal to the percentage that are right-eye dominant of the overall group (60%). The two student response below both do a nice job of making this connection and were scored essentially correct for part (d).
Common misunderstandings
Parts (a) and (c): Calculate marginal relative frequencies and conditional relative frequencies for a give two-way table.
The most common student error on part (a) was failure to recognize the conditional nature of the percentages that were to be calculated. Students making this error calculated overall percentages, using 100 (the total sample size) in the calculations rather than the row totals. Because part (c) does ask for the overall percentage, students who demonstrated this misconception often got the correct answer in part (c). This error is illustrated in the student response below.

Part (b): Determine if there is evidence of association between two categorical variables.
The most common student error in part (b) was made by students who correctly concluded that there was an association between hand-dominance and eye-dominance, but failed to make a direct appeal to the conditional percentages calculated in part (a) in their explanation. The following student response illustrates this error. This response was considered to be only partially correct for part (b) because the explanation was judged to be weak because it did not refer to the conditional percentages.
Other students tried to base an explanation based on comparing the conditional percentages to 50% rather than to each other, as illustrated in the following student response.
Part (d): Identify the value of a row relative frequency that would be consistent with no association.
In answering part (d), some students reached a correct conclusion, but provided an explanation that was considered to be weak. For example, the student response below was scored as only partially correct because although the student correctly chooses 60% as the expected percentage, the explanation does not indicate that this percentage was chosen because it was the percentage for the overall group.
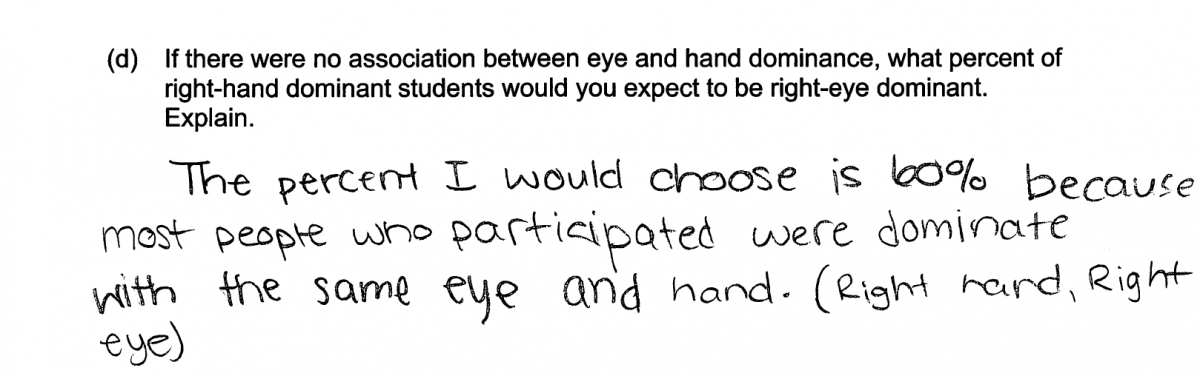
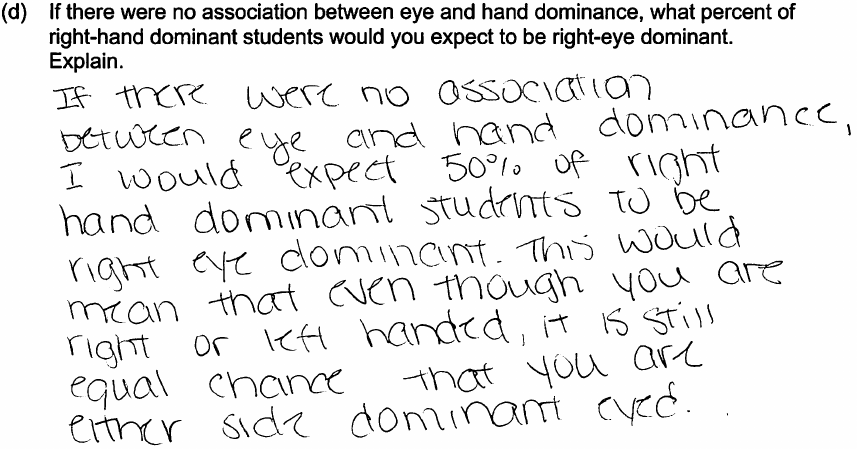
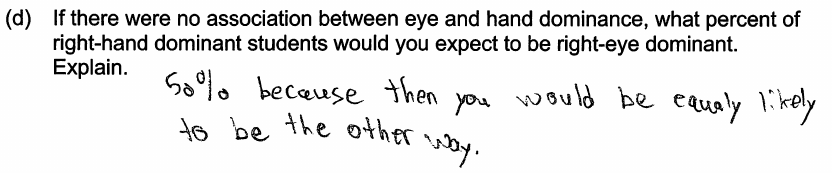
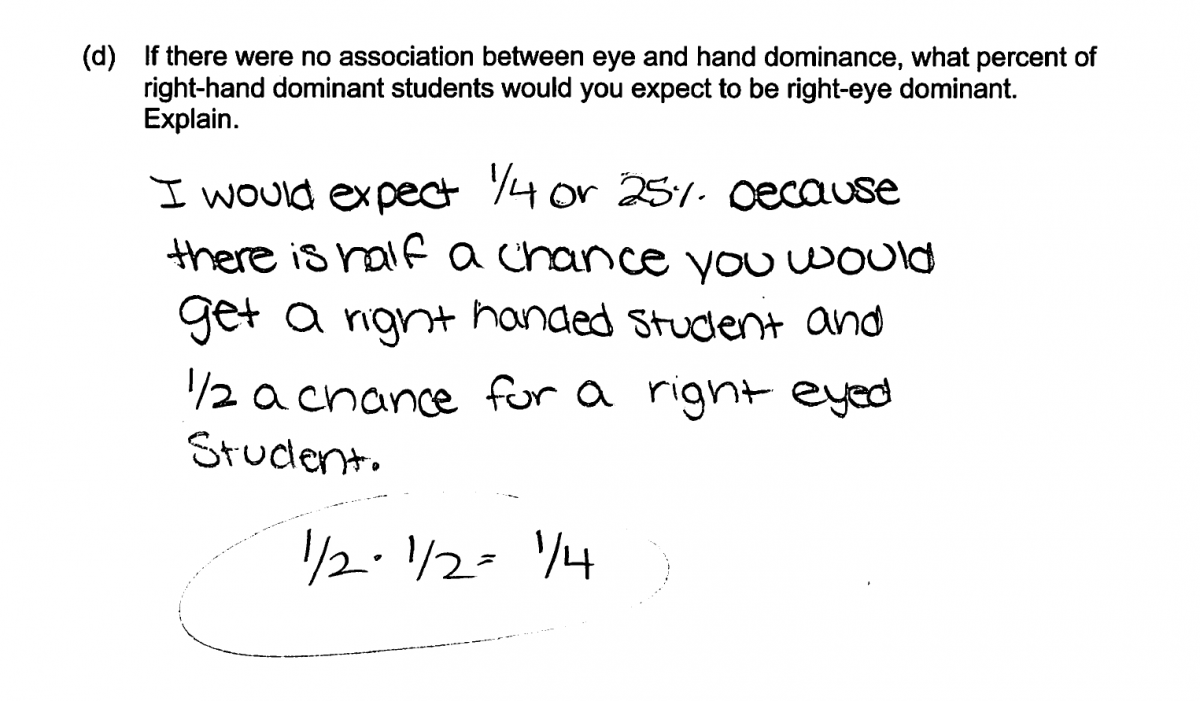
A common student misconception in part (d) was that no association between eye and hand dominance would mean that for each hand-dominance group, 50% would be left-eye dominant and the other 50% would be right-eye dominant. This type of misconception correctly indicates that no association between the variables means that the percentage of left-hand and right-hand dominant people having right-eye (or left-eye) dominance is the same but incorrectly estimates the percentage as 50% rather than the overall percentage for the group. The following four student responses are typical of those making this error.

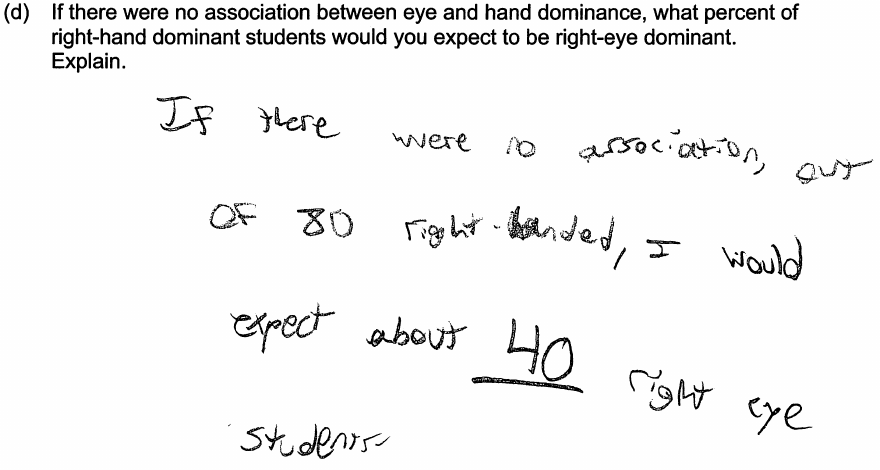
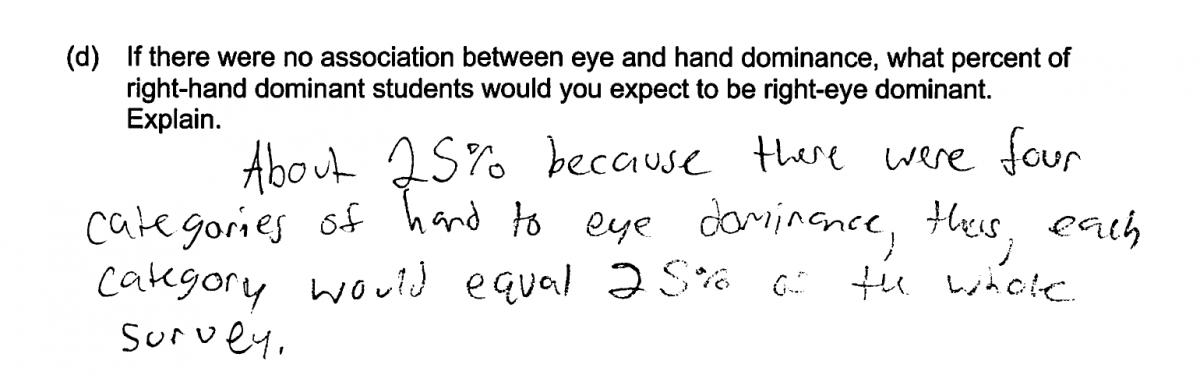
A misconception that is similar to the one just mentioned is the belief that because there are four possible hand-dominance eye-dominance combinations, independence would require 25% of the people to fall into each of these four categories. This error in thinking is illustrated by the following two student responses.
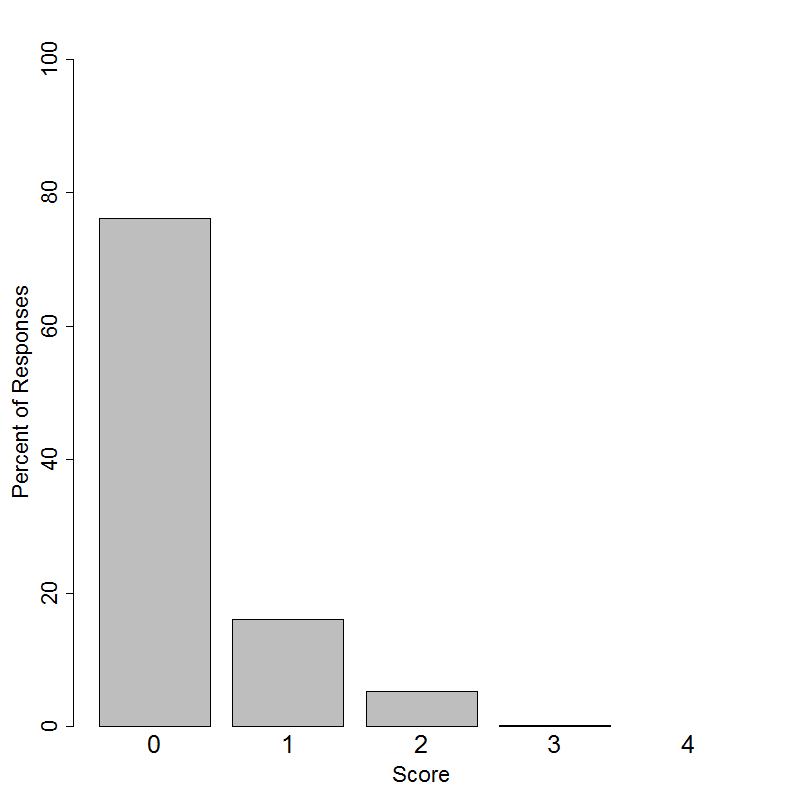
Student performance
Resources
More information about the content assessed in this question can be found in the following resources.
Free Resources
Lessons
Statistics Education on the Web (STEW) has peer reviewed lessons plans that can be found at Some lessons related to the topic of this question are:
You Will Soon Analyze Categorical Data (Classifying Fortune Cookie Fortunes)
The Case of the Careless Zookeeper
Applets
The Rossman/Chance Applet Collection has an applet for Analyzing Two-Way Tables using both the Chi-Squared test and a randomization-based approach. This applet is related to the content of this item but does so at a more advanced level.
Classroom and Assessment Tasks
Illustrative Mathematics has peer reviewed tasks that are indexed by Common Core Standard. Two tasks relevant to the concepts assessed in this Locus question are:
S-IC, S-ID Musical Preferences
Support for a Longer School Day?
Guidelines for Assessment and Instruction in Statistics Education (GAISE)
Published by the American statistical Association and available online, this document discusses the learning progression for students regarding the topics of categorical variables, two-way tables, and association through the Popular Music example at levels B (p.38-40 and p.95-98) and C. (p.71-75).
Resources from the American Statistical Association
Bridging the Gap Between Common Core State Standards and Teaching Statistics is a collection of investigations suitable for classroom use. This book covers association between two categorical variables in Investigation 4.4, “Can You Roll Your Tongue?” p.153-162. This investigation is available as the free sample lesson for the book.
Making Sense of Statistical Studies is a collection of investigations suitable for classroom use. Association between categorical variables in explored in Investigation 8 p.87-94, Investigation 12 p.138-144, and Investigation 15 p.166-181.
Resources from the National Council of Teachers of Mathematics
The NCTM publication Statistical Questions from the Classroom discusses association and independence on p.29-33.
The NCTM publication Developing Essential Understanding of Statistics in Grades 6 – 8 covers association between two categorical variables in Big Idea 3, p.52-56.
The NCTM publication Navigating through Data Analysis in Grades 9 – 12 covers making decisions with categorical data on p.29-41. Additionally, Problems 1 and 2 on p.79-85 cover association between two categorical variables.