Lindsey wants to use a confidence interval to estimate the difference in the proportion of females and males at her high school who have taken an honors class. She randomly selects 50 females and 50 males from her school and asks each one if he or she has taken an honors course. Of the 50 females, 23 responded yes. Of the 50 males, 19 responded yes.
A 95 percent confidence interval for the difference in the proportion of females and males at her school who have taken an honors class is 0.08 ± 0.19.
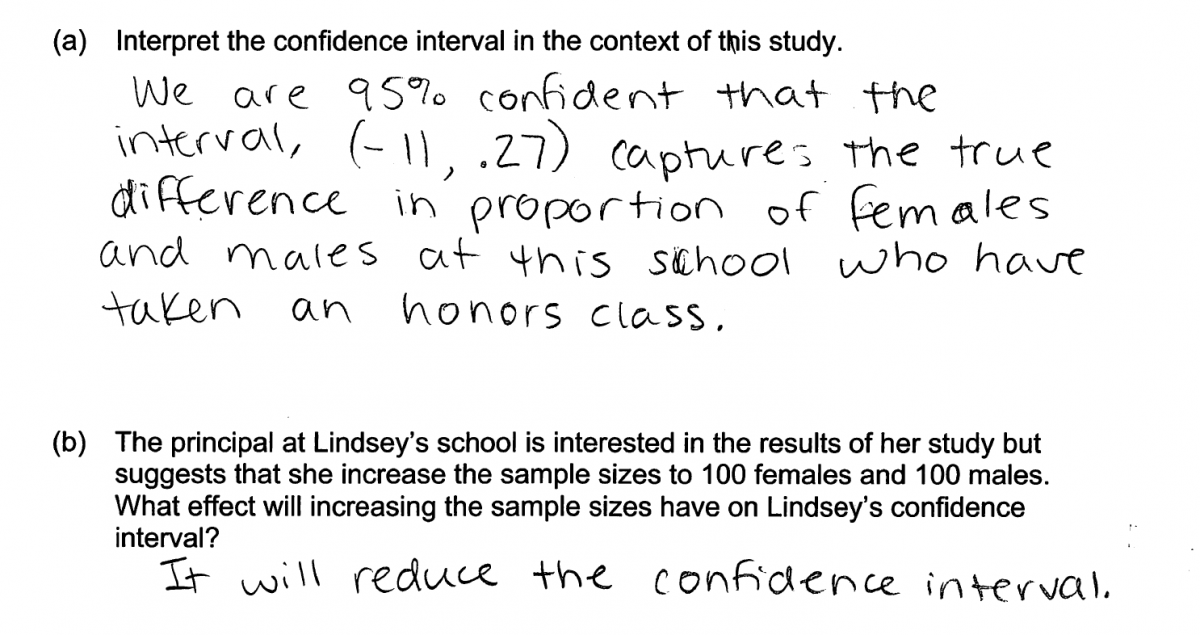
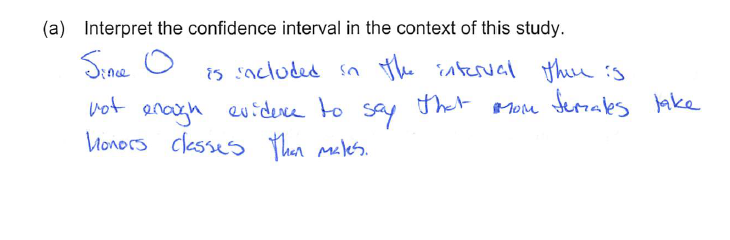
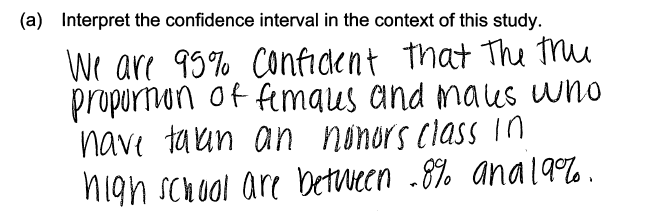
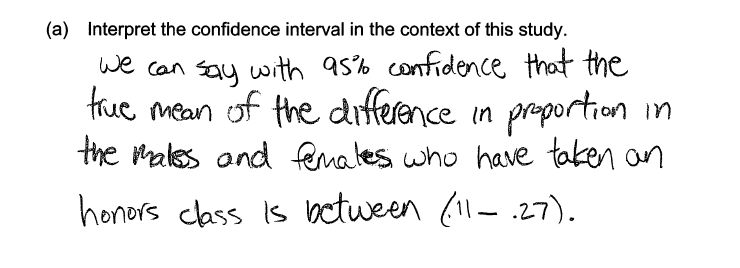
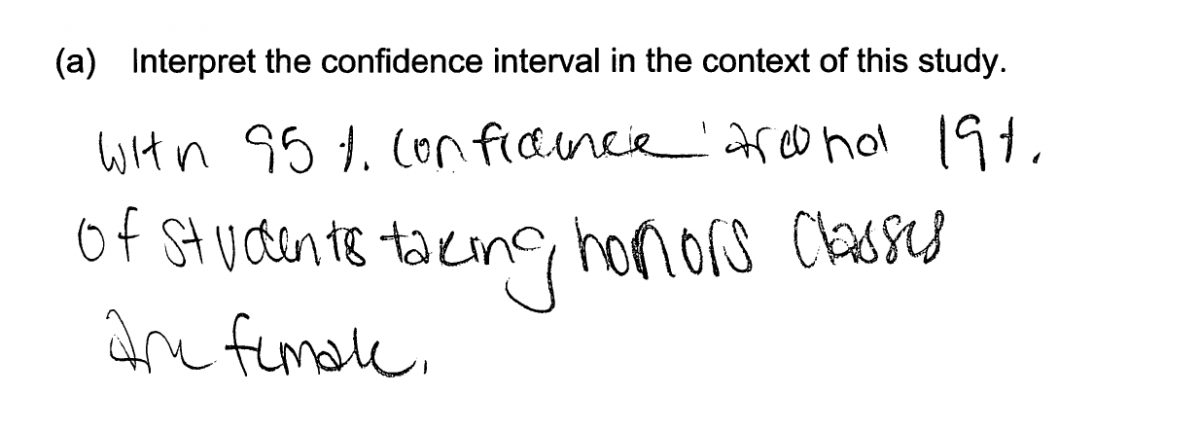
(a) Interpret the confidence interval in the context of this study.
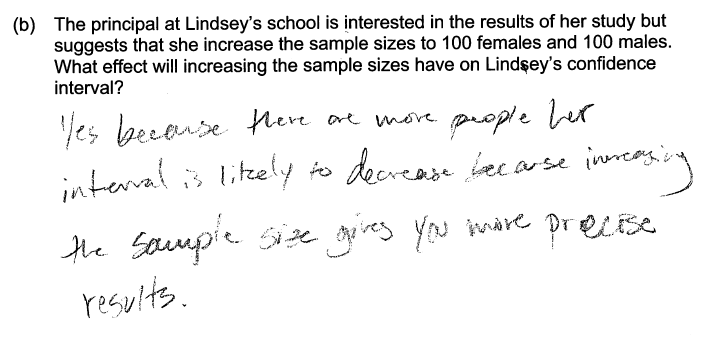
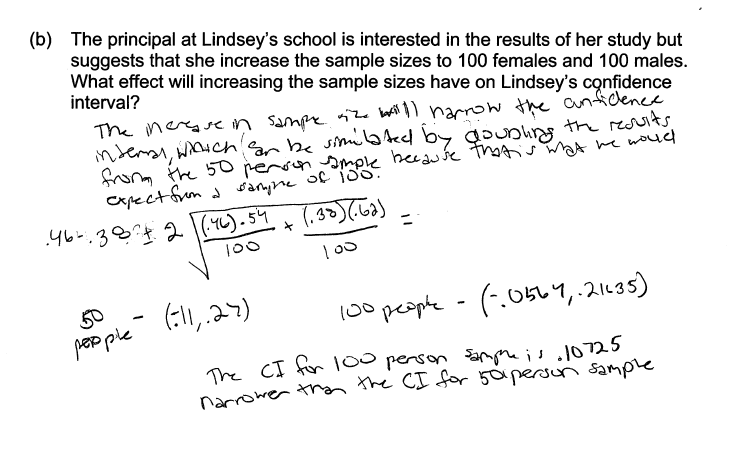
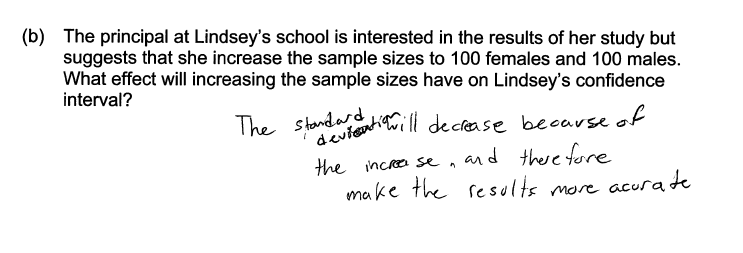
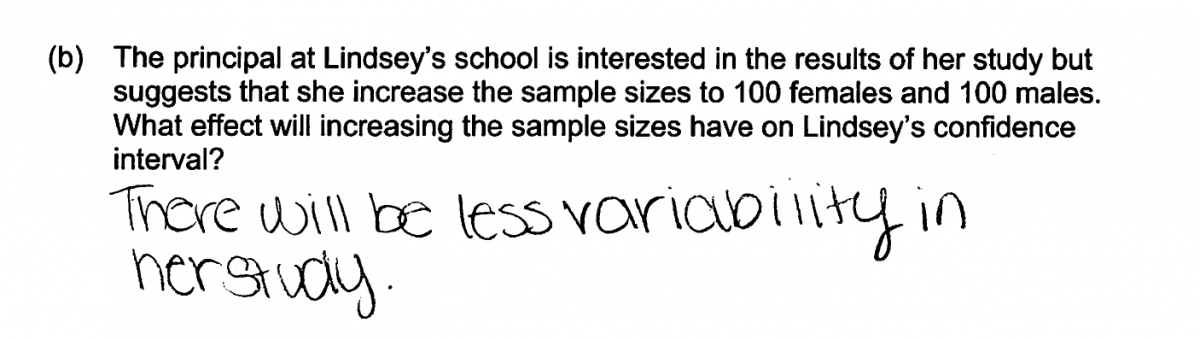
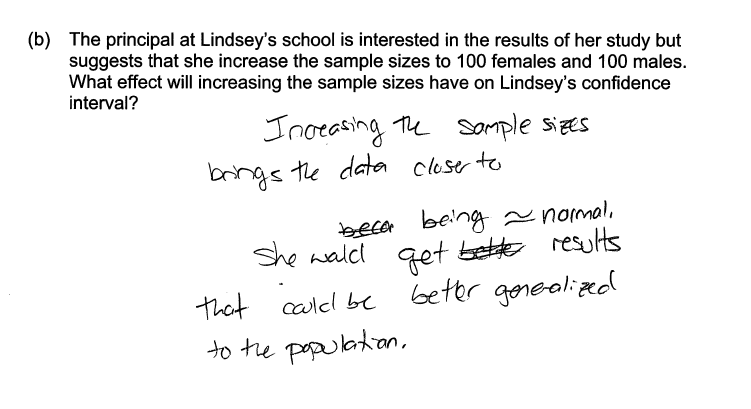
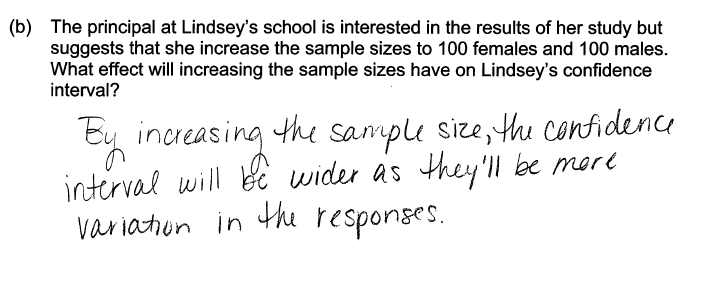
(b) The principal at Lindsey’s school is interested in the results of her study but suggests that she increase the sample sizes to 100 females and 100 males. What effect will increasing the sample sizes have on Lindsey’s confidence interval?
Overview of the question
This question is designed to assess the student’s ability to:
1. Interpret a confidence interval for the difference between two population proportions (part (a)).
2. Recognize how sample size influences the width of the confidence interval (part (b)).
Standards
S-IC.4: Use data from a sample survey to estimate a population mean or proportion; develop a margin of error through the use of simulation models for random sampling.
Ideal response and scoring
Part (a):
An ideal response to part (a) uses the given estimate and margin of error to find the endpoints of the confidence interval estimate of the difference in the population proportion of females and the population proportion of males who have taken an honors course and provides an appropriate interpretation for that interval. A complete response includes three parts: a reference to the difference in proportions in context, the confidence level, and correct numerical values for the endpoints of the interval. If the response includes only two of the three parts, the response is considered partially correct.
Alternatively, the confidence interval can be used to decide whether there is convincing evidence of a difference between the population proportion of males and the population proportion of females who have taken an honors course. Taking this approach, an ideal response to part (a) notes that 0 is in the confidence interval – meaning 0 is a plausible value for the difference of proportions – and concludes that there is not convincing evidence of a difference between the population proportion of males and the population proportion of females who have taken an honors course. If the conclusion is drawn without indicating that 0 is in the confidence interval, the response is considered partially correct.
Part (b):
An ideal response to part (b) recognizes that increasing the sample size decreases the margin of error, making the confidence interval narrower. This understanding can be demonstrated by indicating that increasing the sample size will decrease the margin of error, improve the precision of our interval, or make the interval narrower. If the response indicates that the increase in sample size decreases variability without a clear connection to the effect on the confidence interval, the response is considered only partially correct. Generic comments indicating that a larger sample size improves the study without explicitly referencing variability or the effect on the confidence interval are considered incorrect.
Sample responses indicating solid understanding
The following student response shows a good understanding of the concepts assessed by this question and received a score of 4. In part (a), the estimate and margin of error are used to find the endpoints of the confidence interval, the interval is interpreted correctly in context, and the confidence level is appropriately referenced. In part (b), the response indicates that increasing the sample size will narrow or “shorten” the confidence interval. With both parts essentially correct, this response received a score of 4.
In part (a), some students interpreted the confidence interval to determine whether the difference in the population proportion of males and the population proportion of females who have taken honors classes is statistically significant. The response below notes that 0 is in the confidence interval, and concludes that there is not enough evidence to say more females take honors classes than males. That is, 0 is a plausible value for the difference between the proportion of females and proportion of males that take honors classes in the school population. This alternative approach is illustrated in the response below. While this response would have been stronger if it referred to proportions, this response was still scored as essentially correct for part (a).
There were also a number of ways that a student could demonstrate understanding of how the confidence interval would change if the sample size were increased. Although the responses below range from intuitive justification to formal calculation of a new interval based on sample sizes of 100, all three were scored essentially correct.
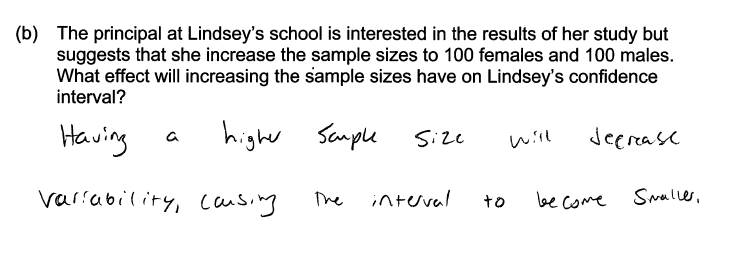
An example of a response to part (b) that shows understanding of the underlying concepts but which was considered only partially correct is shown below. This response notes that increasing the sample size will decrease variability, but the connection to confidence intervals is not clearly indicated.
Common misunderstandings
Part (a): Interpret a confidence interval for the difference between two population proportions.
Some students misinterpreted the notation in the problem (point estimate +/- margin of error) and consequently made mistakes in finding the endpoints of the confidence interval. However, much more common were issues with the interpretation of the interval. Some students struggled to describe the parameter being estimated – a difference of proportions – in context. The responses below illustrate student difficulties in calculating the endpoints of the confidence interval or in describing the parameter (difference in population proportions) in context.
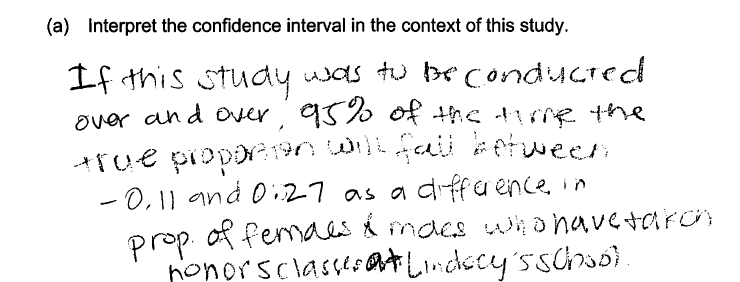
 Some students attempted to describe the confidence level in terms of the “capture rate” of the actual difference in population proportions, but made critical errors in their descriptions. A correct interpretation of the confidence level would note that if the process of taking random samples and calculating a confidence interval were repeated many times, the true parameter would be captured by the interval about 95% of the time. The interval would vary from sample to sample (it wouldn’t always be the interval from -0.11 to 0.27) and the sample difference in proportions would be included in every interval. The following two responses illustrate this error. These responses were scored as incorrect for part (a).

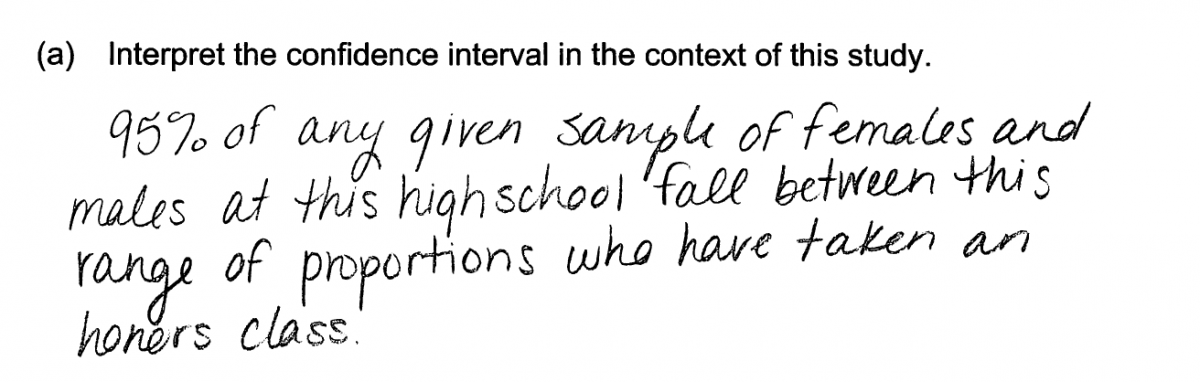
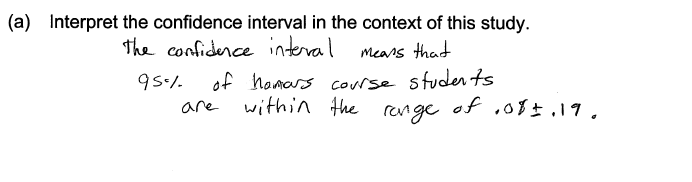
Some students failed to recognize that interpretations of confidence intervals are statements about parameters, not about sample statistics or about individuals in the population. The two responses below illustrate the common misunderstanding that the confidence level refers to the percentage of individuals in the population that are in a particular range.
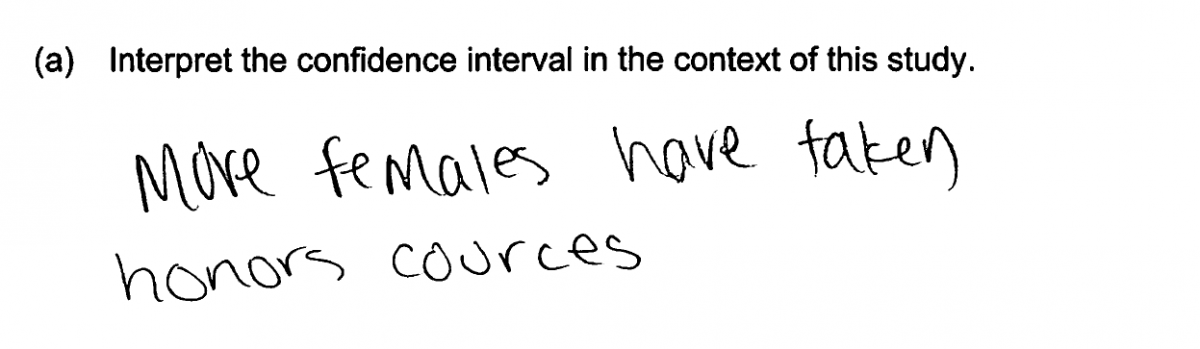
Finally, there were a number of students who provided responses that indicated that they were not familiar with confidence intervals as a method for estimating a parameter or that they did not understand what was being estimated by the given confidence interval. This is illustrated by the following two student responses, which were scored as incorrect for part (a).
Part (b): Recognize how sample size influences the width of the confidence interval.
Many responses to part (b) recognized that increasing the sample size would improve the study but failed to provide a clear explanation of how the confidence interval would change. The following response is typical of those making this omission.
Other responses focused on other aspects of the confidence interval procedure, such as confidence level or the conditions necessary for the confidence interval procedure to be appropriate, but did not address how the confidence interval itself would change. For example, the responses below focus on the assumption of normality and the confidence level instead of the width of the confidence. These responses do demonstrate emerging understanding of the concepts being assessed. For example, when sample size increases, the sampling distribution of the difference of proportions does become more normal. Larger sample sizes can produce higher confidence levels for intervals of similar width; however, the confidence level is typically set in advance, not calculated based on a particular interval and sample size. However, because these responses do not address the effect of increasing sample size on the interval itself, they were scored as incorrect for part (b).
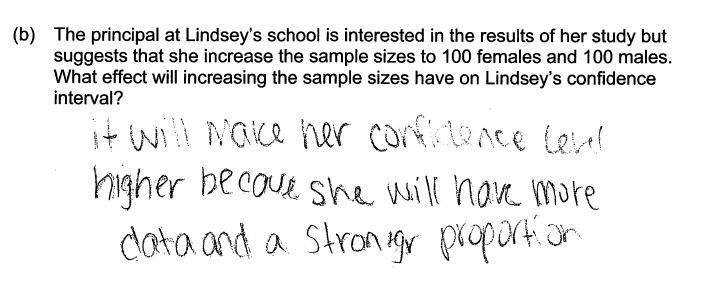
Some students reversed the relationship between sample size and the width of the confidence interval, erroneously assuming that more data would lead to a wider interval. The following response illustrates this misunderstanding and was scored as incorrect for part (b).
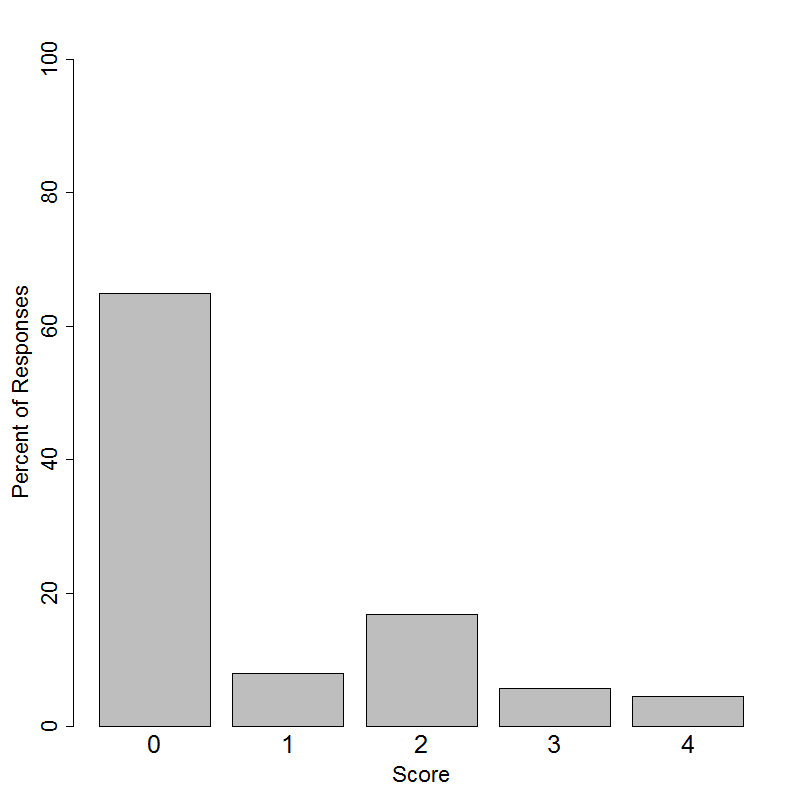
Student performance
Resources
An understanding of confidence intervals is critical to the development of students’ statistical reasoning. More information about this topic can be found in the following resources.
Free Resources
Lessons
Statistics Education on the Web (STEW) has peer reviewed lessons plans. Some lessons related to the topic of this question are:
I Always Feel like Somebody’s Watching Me (Part A)
Applets
There are a number of online applets that can be used to illustrate confidence intervals. One easy to use applet is in the RossmanChance applet collection. It can be used to illustrate how changes in sample size affect the width of the confidence interval
Classroom and Assessment Tasks
Illustrative Mathematics has peer reviewed tasks that are indexed by Common Core Standard. Although formal confidence intervals are not part of the Common Core, Standard S.IC.4 is relevant to the concepts of sampling variability and margin of error. A few tasks relevant to this standard are:
Guidelines for Assessment and Instruction in Statistics Education (GAISE)
Published by the American Statistical Association and available online, this document presents several examples that illustrate sampling variability (including discussions of margin of error) on pages 67 – 84.
Common Core Progressions Documents
A discussion of the intent of Common Core standard S.IC.4 and how this content might be developed in the classroom can be found in Common Core Tools progressions document for statistics in grades 9 – 12. See the discussion on pages 8 - 12.
Print Resources
Teaching Statistics: A Bag of Tricks by Andrew Gelman and Deborah Nolan is a collection of demonstrations, examples, and projects suitable for classroom use. Chapter 8 looks at statistical inference and is relevant to the concepts assessed in this question. In particular, sections 8.3 and 8.4 present examples and demonstrations related to confidence intervals.