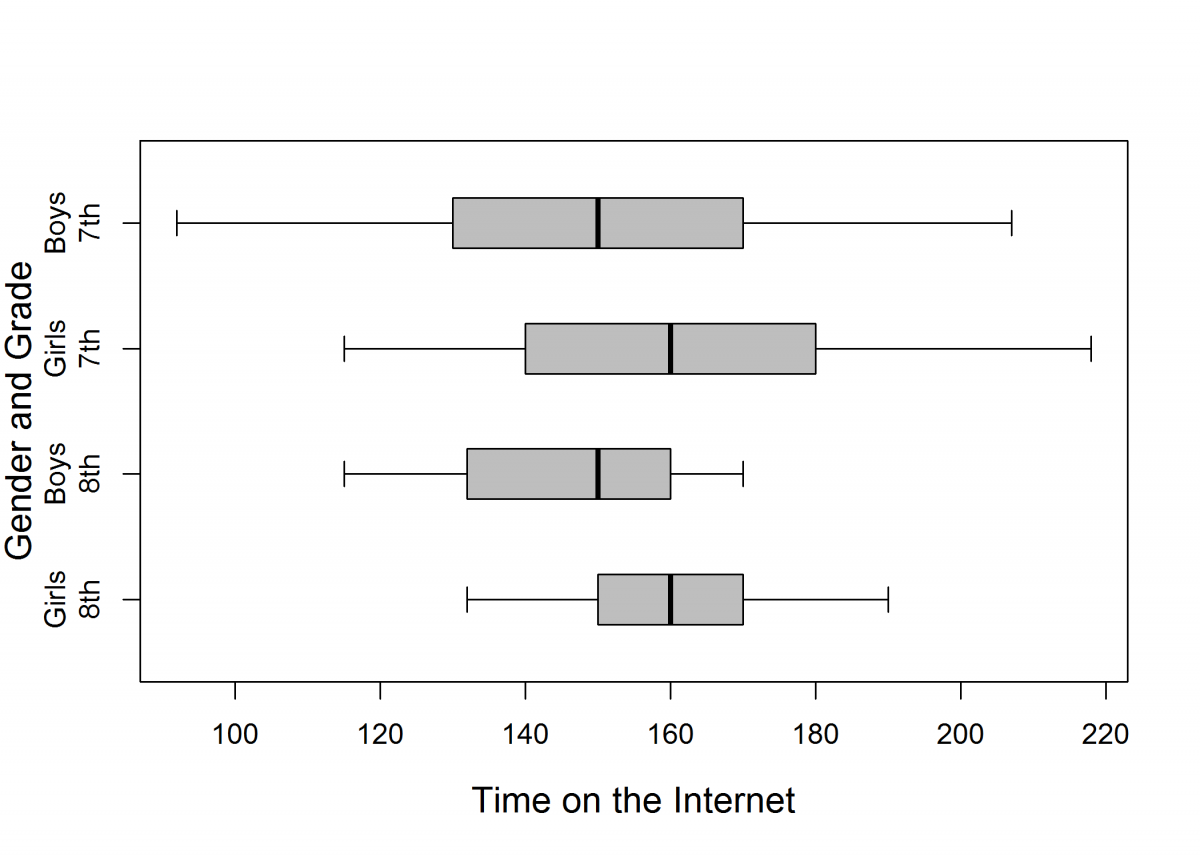
To investigate the amount of time that seventh- and eighth-grade students spend on the Internet, a random sample of fifty seventh-grade students (25 girls and 25 boys) and a random sample of fifty eighth-grade students (25 girls and 25 boys) monitored their time (in minutes) on the Internet for one day.
The five-number summaries, IQRs (interquartile ranges), ranges, and side-by-side boxplots are shown below.
Seventh-Graders
| Minimum | First Quartile | Median | Third Quartile | Maximum | IQR | Range | |
| Boys | 92 | 130 | 150 | 170 | 207 | 40 | 115 |
| Girls | 115 | 140 | 160 | 180 | 218 | 40 | 103 |
Eighth-Graders
| Minimum | First Quartile | Median | Third Quartile | Maximum | IQR | Range | |
| Boys | 115 | 132 | 150 | 160 | 170 | 28 | 55 |
| Girls | 132 | 150 | 160 | 170 | 190 | 20 | 58 |
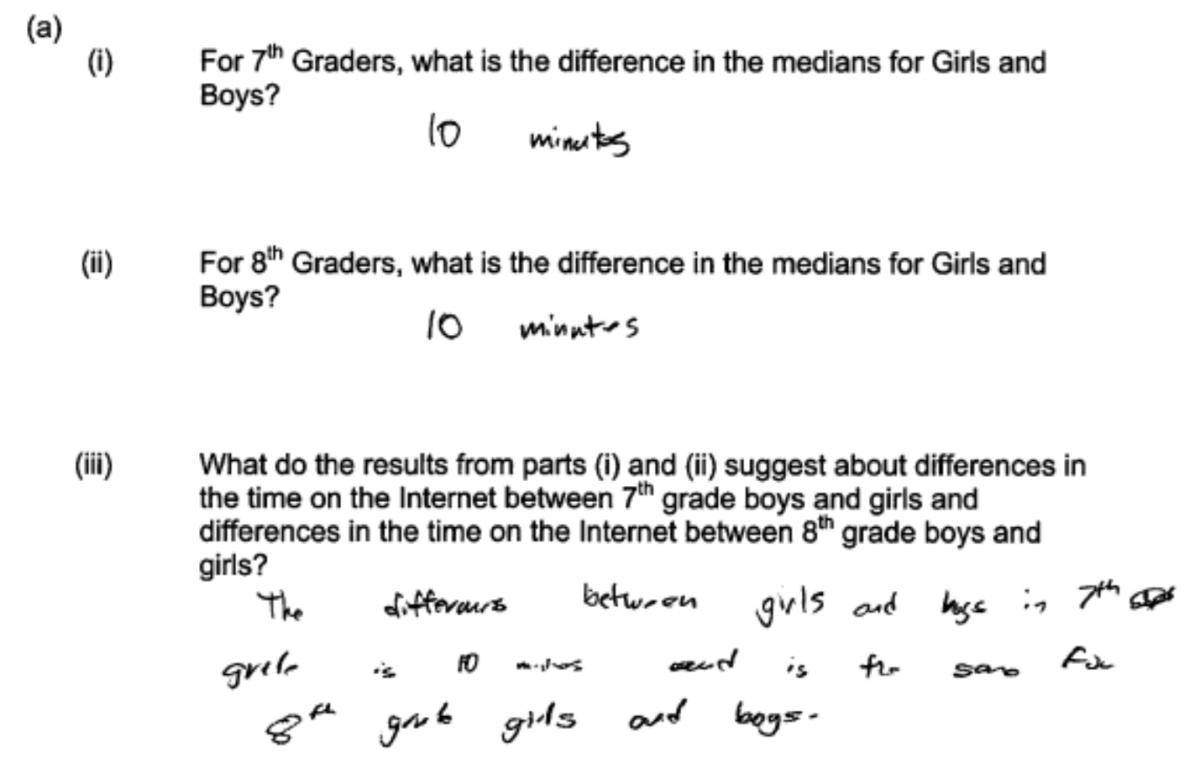
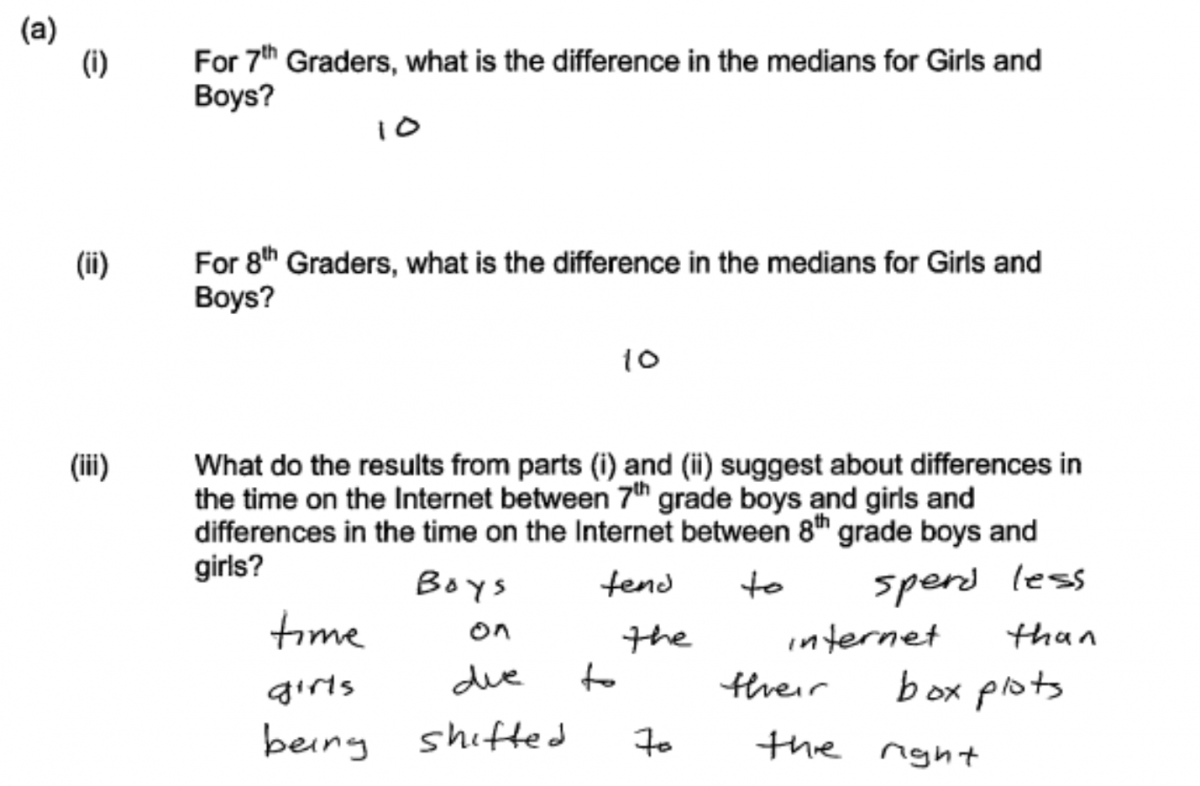
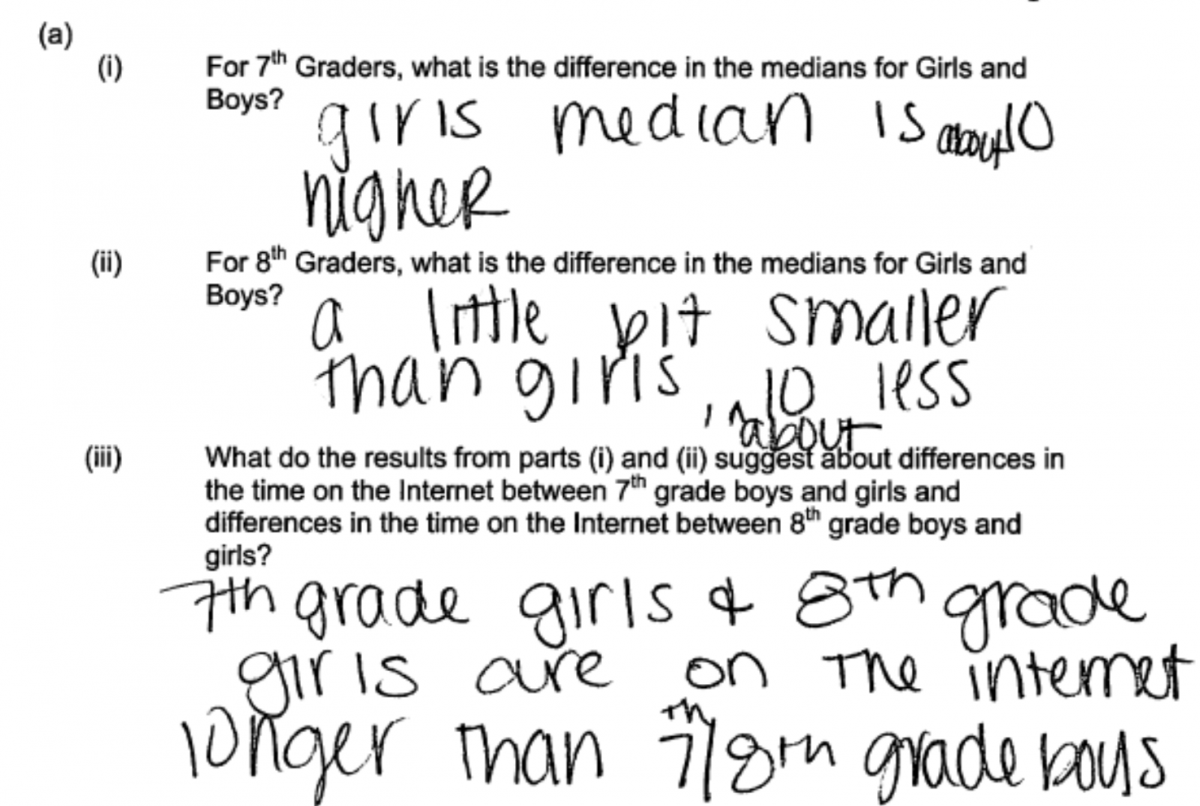
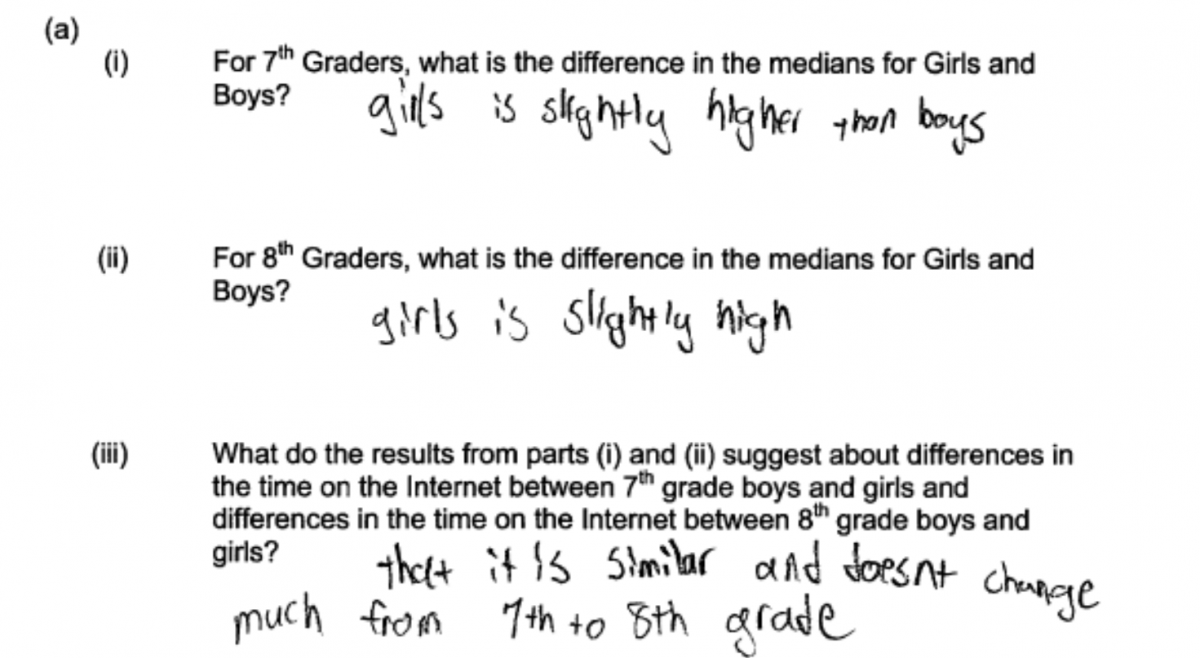
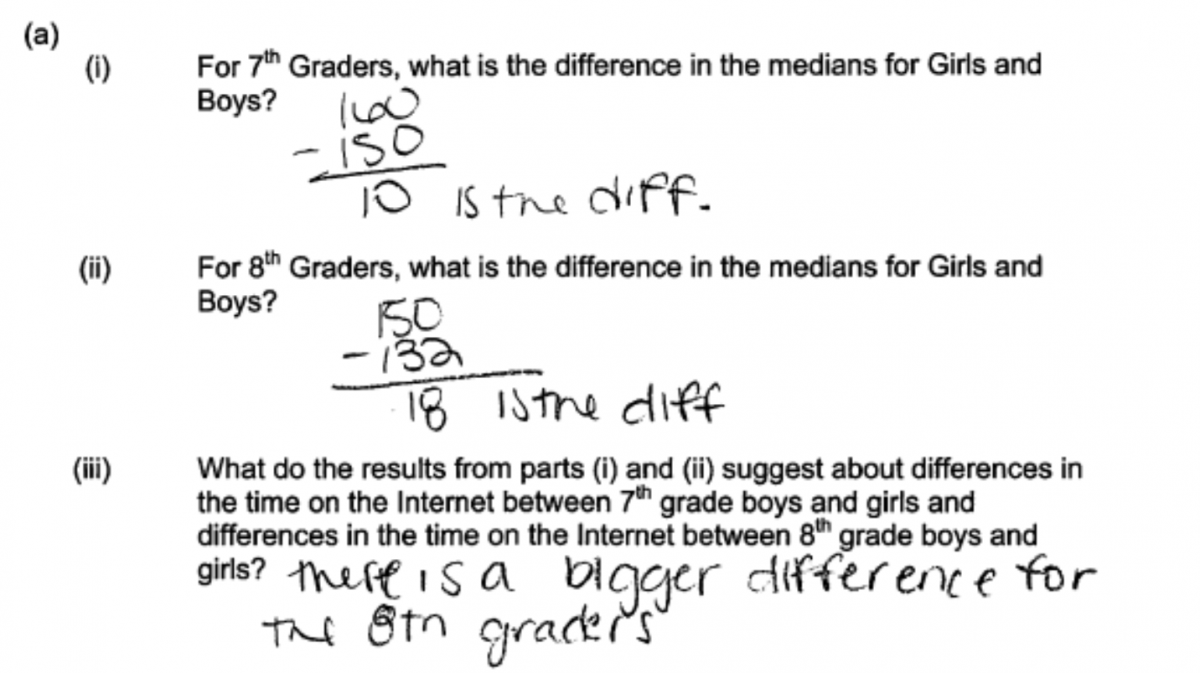
(a) (i) For 7th Graders, what is the difference in the medians for Girls and Boys?
(ii) For 8th Graders, what is the difference in the medians for Girls and Boys?
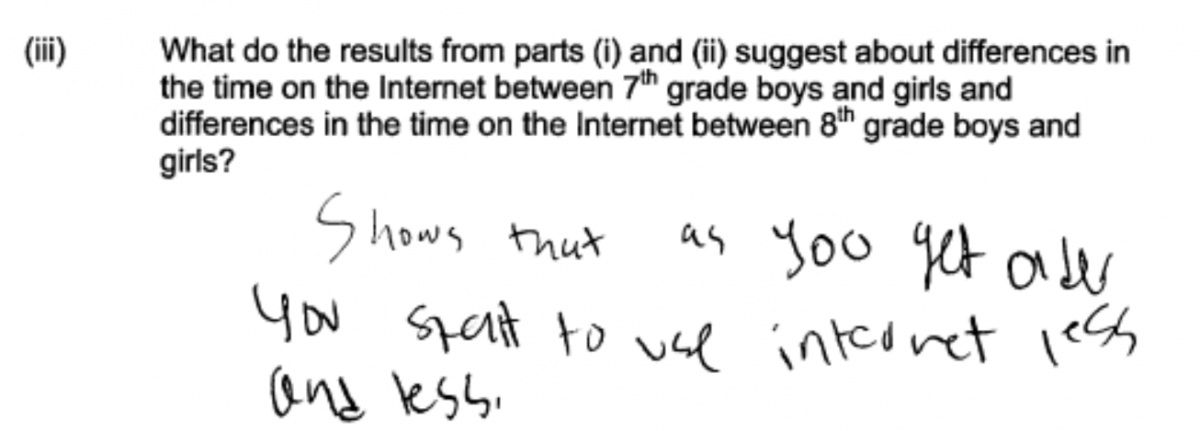
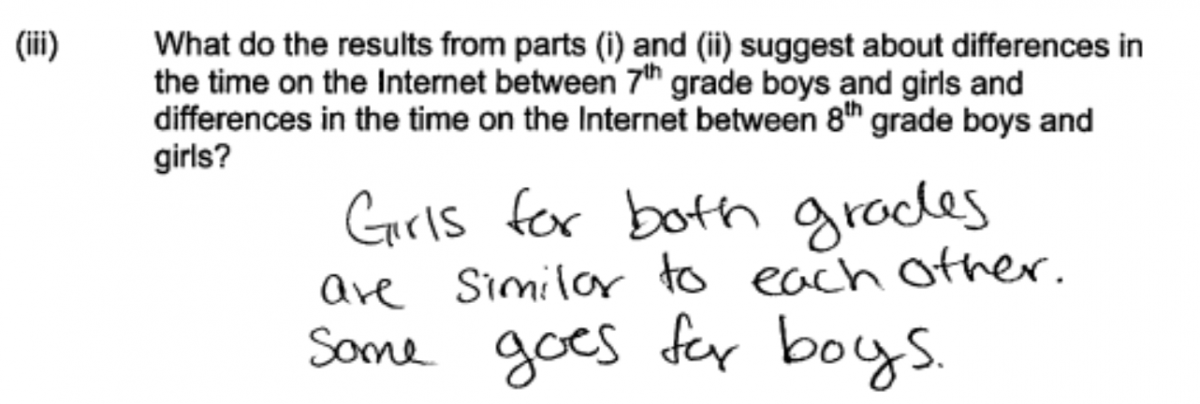
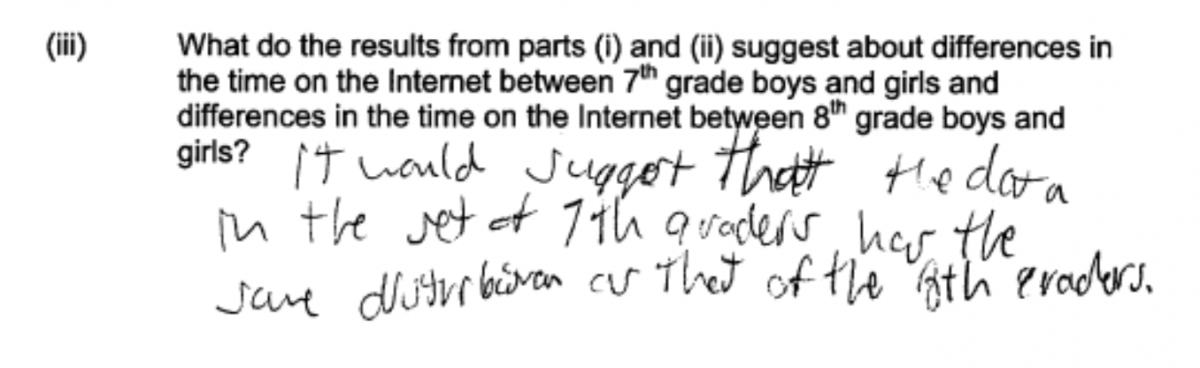
(iii) What do the results from parts (i) and (ii) suggest about differences in the time on the Internet between 7th grade boys and girls and differences in the time on the Internet between 8th grade boys and girls?
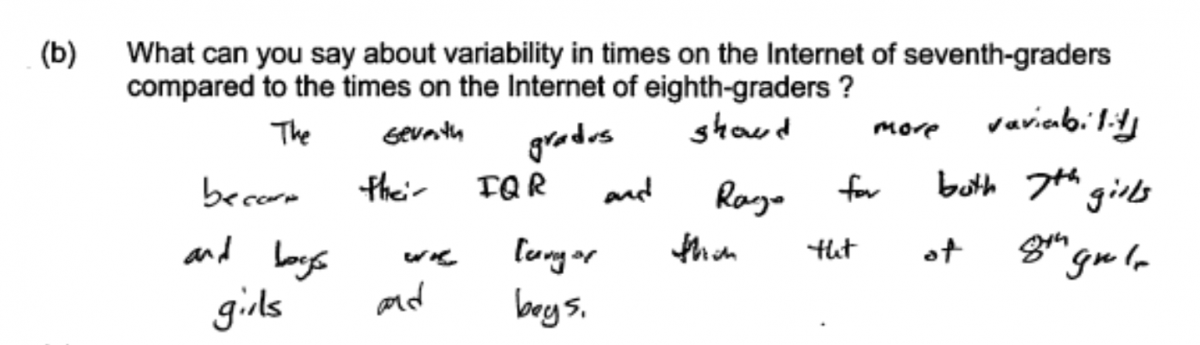
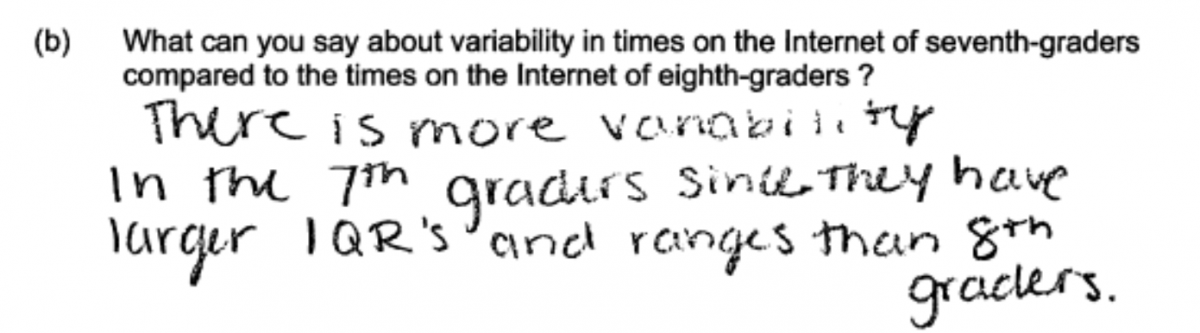
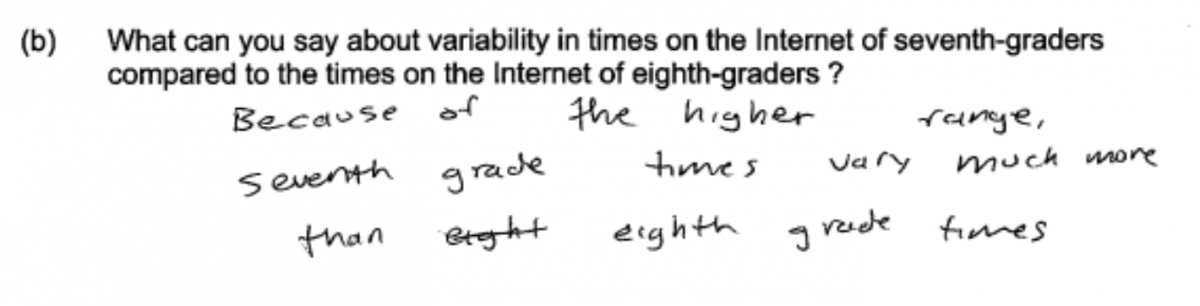
(b) What can you say about variability in times on the Internet of seventh-graders compared to the times on the Internet of eighth-graders?
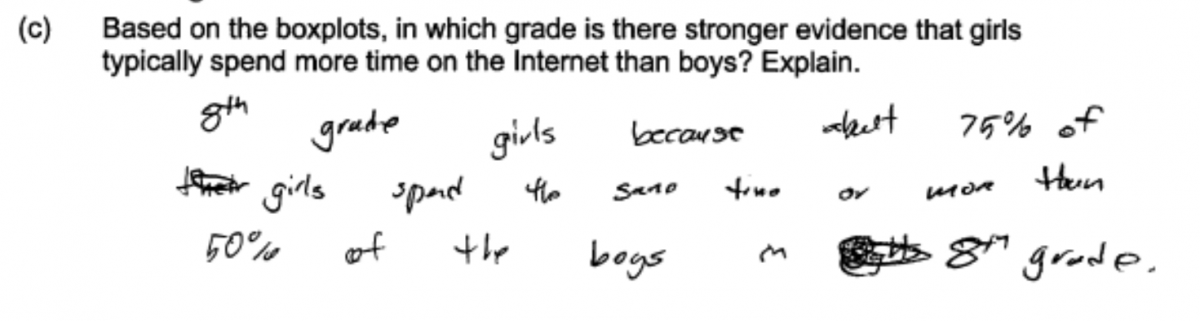
(c) Based on the boxplots, in which grade is there stronger evidence that girls typically spend more time on the Internet than boys? Explain.
Overview of the question
This question is designed to assess the student’s ability to:
1. Calculate and compare differences in medians (part (a)).
2. Use boxplots and summary statistics to compare the variability in two or more data distributions (part (b)).
3. Informally assess the degree of overlap of two numerical data distributions with similar variability (part (c)).
4. Assess the strength of evidence for a difference in medians in a way that takes variability into account (part (c)).
Standards
7.SP.3: Informally assess the degree of visual overlap of two numerical data distributions with similar variabilities, measuring the difference between the centers by expressing it as a multiple of a measure of variability.
7.SP.4: Use measures of center and measures of variability for numerical data from random samples to draw informal comparative inferences about two populations.
Ideal response and scoring
Part (a):
Part (a) asks students to use given summary statistics to calculate the difference in medians for girls and boys for each of two grades. Students are also asked to comment on what the computed differences imply about the two grade levels. An ideal response to part (a) includes correct calculation of the difference in median time spent of the internet for boys and for girls for each of the two grade levels. An ideal response would then note that the difference in medians for seventh grade and eighth grade is the same and comment that both the medians (150 minutes for boys and 160 minutes for girls) and the difference in medians (10 minutes) is the same for the two grade levels.
Responses that provide correct calculations and note that the difference in medians is the same for seventh grade and eighth grade are considered to be essentially correct for part (a). Reponses that make an error in the calculation of the difference in medians but then provide a reasonable statement comparing the two calculated differences are considered to be partially correct for part (a). Also scored as partially correct for part (a) are responses that provide correct values for the two differences in medians but for which the discussion of what these differences imply about the two grades is missing or weak.
Part (b):
Part (b) asks students to comment on the variability in Internet times for the two grade levels. An ideal response to part (b) would note that the variability in times for seventh grade boys and for seventh grade girls is similar, the variability in times for eight grade boys and for eight grade girls is similar, but that there is more variability in the times for 7th graders than for 8th graders. The observation that the 7th grade times are more variability than the 8th grade times would be supported by reference to an appropriate measure of spread, such as the IQR or the range.
Responses that state that there is more variability in the 7th grade times than the 8th grade times but which do not support this statement by referring to a measure of variability are considered to be partially correct for part (b).
Part (c):
Part (c) asks students to indicate whether the strength of evidence is support of a conclusion that says girls spend more time on the Internet than boys is stronger for 7th graders or for 8th graders. After concluding that the evidence is stronger for 8th graders, an ideal response includes a clearly communicated explanation based on the degree of overlap for the corresponding boxplots or based on the smaller variability in the Internet time distributions for 8th graders than for 7th graders.
Responses that indicate that the evidence of a difference is stronger for 8th graders but for which the explanation does not specifically address variability or overlap are considered partially correct for part (c). Responses that indicate that the evidence is stronger for 8th graders but which only address one of the two grades in the explanation are also considered to be only partially correct. Responses with no explanation are considered to be incorrect for part (c), even if they state that the evidence is stronger for 8th graders.
Sample responses indicating solid understanding
Part (a):
The following two student responses received a score of essentially correct for part (a). The difference in medians is calculated correctly for both 7th and 8th grade and a correct comparison of the difference in medians for the two grades is made. In the first response, the student notes that “the difference between girls and boys in 7th grade is 10 minutes and is the same for 8th grade girls and boys.” In the second response, the student notes that “girls spend about 10 more minutes on the Internet compared to boys no matter what grade.”

Part (b):
Ideally responses to part (b) would note that within each grade, the variability in the times for girls and the times for boys is similar but that when looking across grades, the variability is greater for 7th grade times than for the 8th grade times. Students were also expected to use a measure of variability, such as the range or the interquartile range (IQR) to support their conclusion that variability is greater for the times of 7th graders. However, since the question specifically asks about the comparison across grades, a response that did not point out that the variability in the times of boys and girls within each grade was similar was still considered to be essentially correct for part (b).
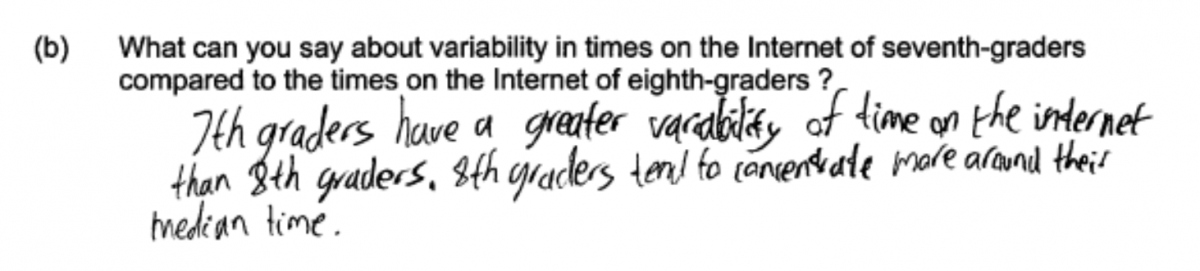
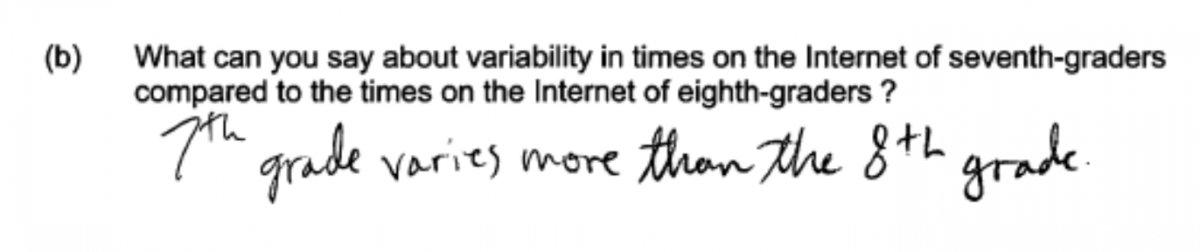
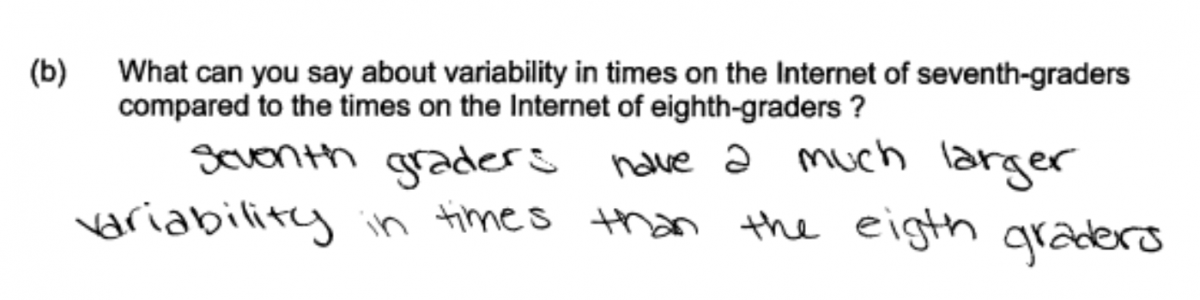
Each of the three student responses shown below was scored as essentially correct for part (b). Although none note the similarity of the variability for boys and girls within each grade, each correctly identifies 7th grade as having more variability and supports that statement with a reference to the range or the IQR or both. Students were not required to give actual numerical values for the ranges or the IQRs in order to receive a score of essentially correct.
Part (c):
Students struggled with (c) and it was clear that most students participating in the pilot administration of this exam did not have a clear understanding of the role of variability in deciding if there is evidence for a difference in medians. To be considered essentially correct for part (c), a response needed to indicate that the strength of evidence was greater for 8th grade than for 7th grade and to justify this conclusion by either appealing to the smaller variability in the 8th grade times or to the degree of overlap in the boxplots for 8th grade compared to 7th grade.
There were a number of acceptable ways that students could word the explanation in part (c). This is illustrated by the following student responses.
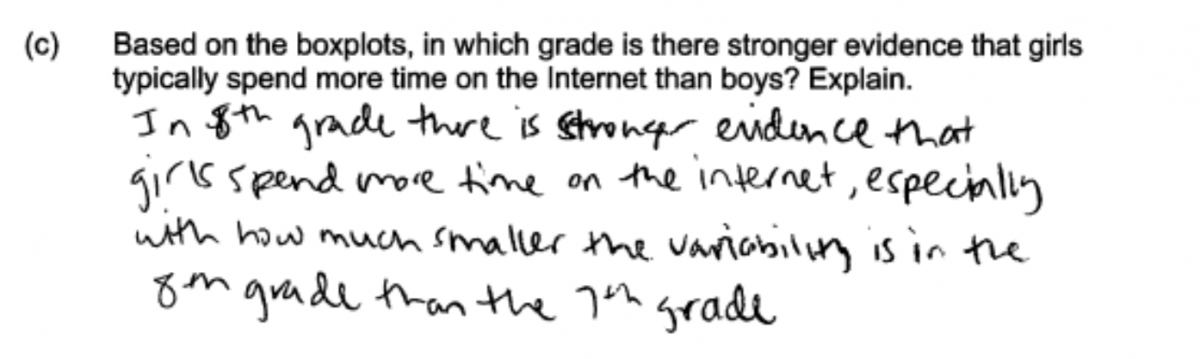
In the first response below, the student selects 8th grade because of “how much smaller the variability is in the 8th grade than the 7th grade.” This response was considered to be essentially correct for part (c) because it references the smaller variability in grade 8.
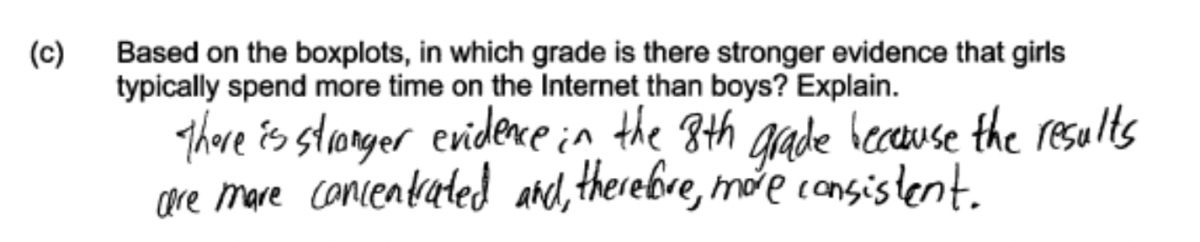
The following student response was also considered to be essentially correct for part (c). The statement that “there is stronger evidence in the 8th grade because the results are more concentrated and, therefore more consistent” was interpreted as a reference to the smaller variability for the 8th grade.
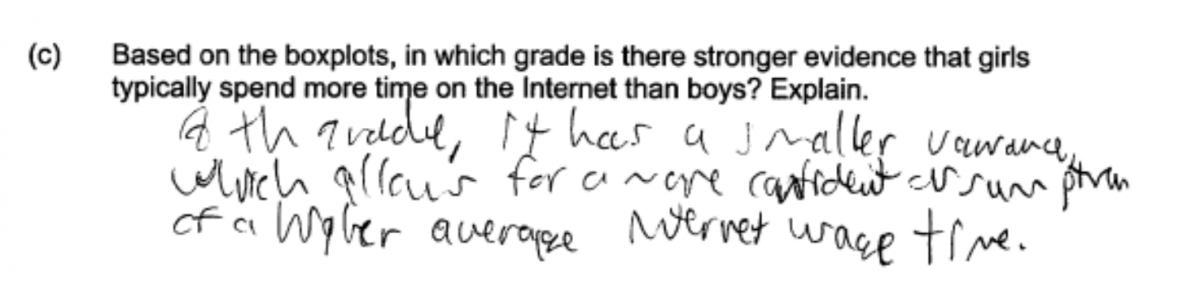
Similarly, in the following student response the statement “it has a smaller varaince which allows for a more confident assumption of a higher average Internet useage time” addresses the smaller variability in the distribution of the 8th grade times. This response was also scored as essentially correct for part (c).
Not many students in the pilot administration provided a justification based on the degree of overlap in the boxplots for girls and for boys in each of the grades. An example of a student response that did focus on the overlap in the box plots is shown below.
Common misunderstandings
Part (a): Calculate and compare differences in medians.
Responses that were not scored as essentially correct for part (a) generally made one of two common mistakes. The most common student error was made by students who calculated the differences in medians correctly, but then failed to comment on the differences between the two grades. Most of these students commented instead on the differences between boys and girls, which did not address the question asked in part (iii) of part (a). This error is illustrated by the following two student responses. Both of these responses were scored as partially correct for part (a).
Some students either did not actually calculate the difference in medians for each of the grades or made errors in calculation. This is illustrated by the following two student responses. In the first, the difference in medians is not calculated, but the statement made in part (iii) is correct. In the second response, an error is made in the calculation of the difference in medians for 8th graders. The statement in part (iii) is correct based on the calculated differences, so this response was considered to be partially correct for part (a).
Of more concern were student responses that made incorrect statements in part (iii). Such responses were scored as partially correct if the differences in medians was calculated correctly for each grade and incorrect if the difference in medians was not calculated correctly for each grade. For example, consider the following three student responses, each of which makes an incorrect statement in part (iii) that indicates a lack of understanding.
In the response below, the student says that “as you get older you start to use the internet less and less.” This is not supported by the summary measures or the boxplots, which have similar centers for the two grade levels. This indicates that the student is confusing center and variability.
In the following response, the student says that “girls for both grades are similar to each other: and that the same goes for boys". This does not address the difference in medians and like the previous response indicates that the student is focused only on center as the variability is noticeable different for the two grades.
The following response includes an incorrect statement that illustrates another misconception. In this response, the student indicates that the times for 7th graders and the times for 8th graders have the same distribution. Here the student believes that if the medians are the same, the distribution must be the same, but this is clearly not the case as the two distributions differ with respect to variability.
Parts (b): Use boxplots and summary statistics to compare the variability in two or more data distributions.
Students who did not receive a score of essentially correct for part (b) generally made one of three common student errors. The most common error was made by students who did not use a measure of variability, such as the range or the interquartile range (IQR), to justify statements about how the variability in times of 7th graders compared to the variability in times of 8th graders. This is illustrated by the following student responses.
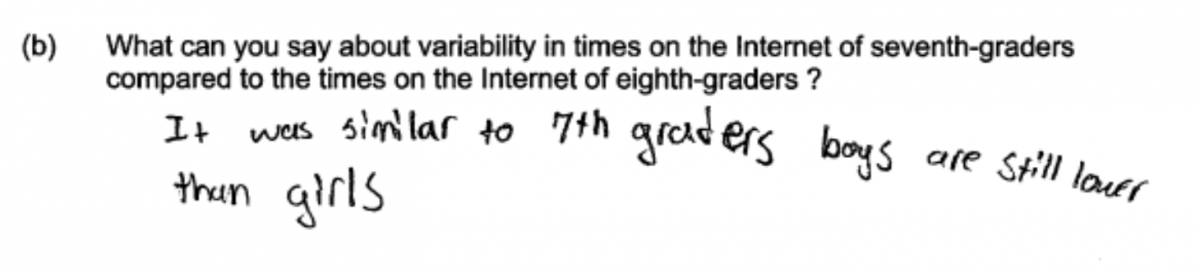
A second common student error in answering part (b) was not recognizing that the question asks about variability. The following student response is typical of those making this error.
A more serious student error in thinking is illustrated by the following student response. This student appears to think that greater variability indicates that 7th graders use the internet more, even though the medians for the two grades are equal.
Part (c): Informally assess the degree of overlap of two numerical data distributions with similar variability. Assess the strength of evidence for a difference in medians in a way that takes variability into account.
Part (c) was designed to address two of the more challenging standards in the Common Core State Standards (7.SP.3 and 7.SP.4). Developing an understanding that informal inferences about differences in populations need to take variability in the data distributions into account presents a challenge for teachers who have not previously had to include statistics in their curriculum.
Students generally found part (c) difficult to answer. Many students reached an incorrect conclusion, and some who did reach a correct conclusion provided an explanation that included incorrect statements.
For example, consider the following two student responses. These students are have chosen 7th grade girls and justify this choice based on the fact that this group includes the greatest Internet use times. These students do not compare the strength of evidence for the two grades and confuse strength of evidence with the maximum.


The following response makes a similar error in reasoning, selecting 7th grade because the upper quartiles and maximums are higher for the 7th grade distributions.
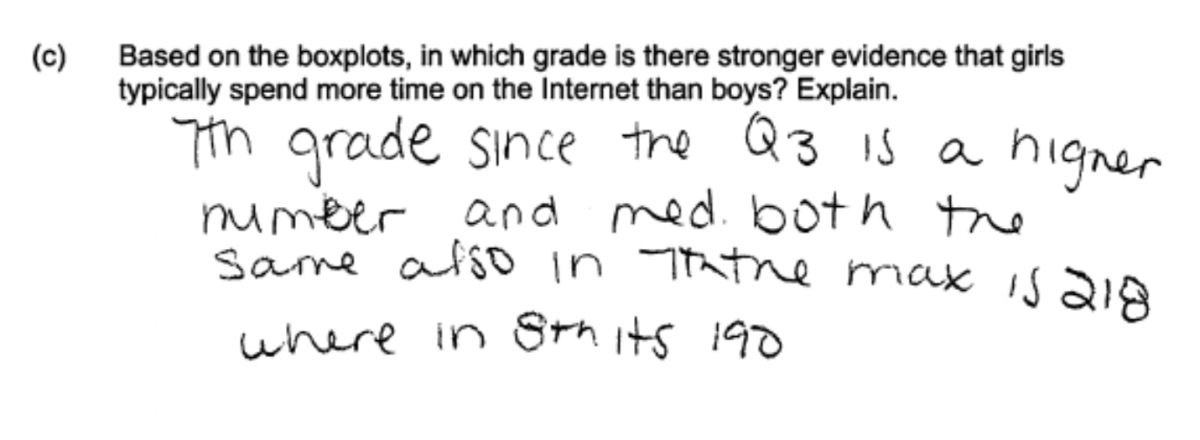
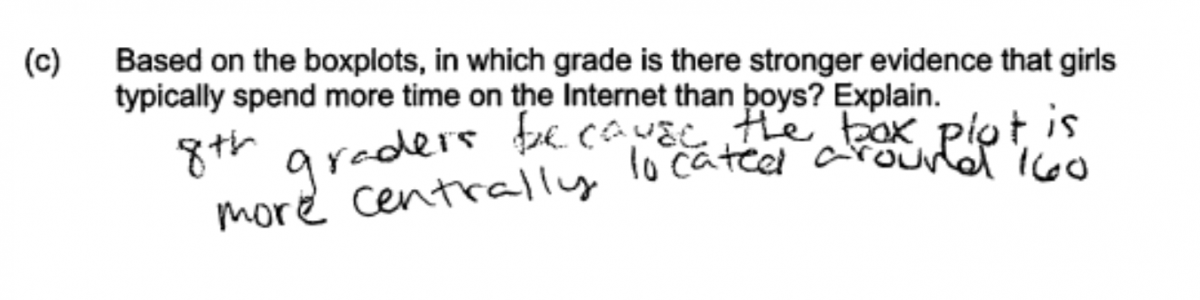
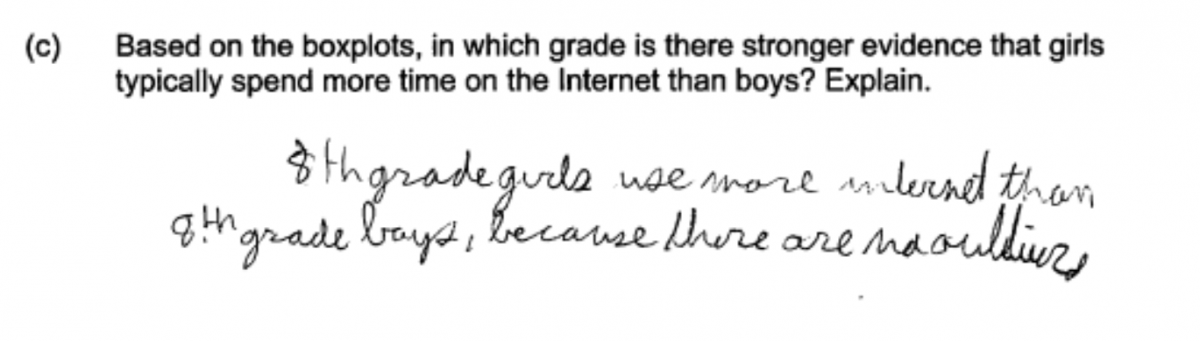
Other student responses included incorrect statements, as illustrated by the following three student responses. In the first response, the student states that the 8th grade boxplot is more centrally located around 160. However the box plot for 7th grade girls is also centered at 160. In the second response below, the statement that 8th grade girls use more internet than 8th grade boys because there are no outliers is not correct. Finally, in the third response below, the statement that the difference between boys and girls is bigger for the 8th grade is not accurate because the difference in medians is the same for both grades (and this student computed these differences correctly in part (a)).

Responses that did not include an explanation were scored as incorrect, even if they stated that the evidence was stronger for 8th graders. This error is illustrated by the following student response, which was scored as incorrect for part (c).
Resources
Resources
More information about the topics assessed in this question can be found in the following resources.
Free Resources
Common Core Progressions Documents
A discussion of informal comparative inference and of the intent of Common Core standards 7.SP.3 and 7.SP.4 and how this content might be developed in the classroom can be found in Common Core Tools progressions document for statistics in grades 6 – 8. See the discussion on pages 9 - 10.
Lessons
Statistics Education on the Web (STEW) has peer reviewed lessons plans. Some lessons related to the topic of this question are:
Bubble Trouble: This lesson has students collect data and then use that data to construct boxplots and draw informal conclusions.
Tell It Like It Is! : This lesson focuses on drawing and communicating conclusions and is particularly relevant to part (c) of this LOCUS question.
Classroom and Assessment Tasks
Illustrative Mathematics has peer reviewed tasks that are indexed by Common Core Standard.
A task that involves drawing informal inferences about the differences between two groups is Offensive Linemen. Although this task uses dot plots rather than box plots in the comparison, the reasoning involved is similar to what is done when using boxplots.
Resources from the American Statistical Association
Bridging the Gap Between Common Core State Standards and Teaching Statistics is a collection of investigations suitable for classroom use. This book contains an investigation that involves using boxplots to make an informal inference and assessing the degree of visual overlap (How Fast Can You Sort Cards?, pages 126 – 140). The Example of ‘Interpret the Results’ section (pages 135 – 137) illustrates the type of reasoning needed to answer parts of this LOCUS question.
Resources from the National Council of Teachers of Mathematics
The NCTM publication Developing Essential Understanding of Statistics in Grades 6 – 8 includes a section on comparing distributions on pages 42 – 51.The discussion of separation and overlap between distributions is particularly relevant to the content assessed in this LOCUS question.