A study was conducted to investigate how texting on a mobile device impairs driving ability. To address this issue, 126 participants drove an instrumented research vehicle on a closed driving course. The participants were randomly divided into the following groups:
Control: No text messages were sent or received on their mobile device.
Typing: Driver composed a story on their mobile device.
Reading: Driver read a story on their mobile device.
To measure impairment of driving ability, two different observations were made:
Mean speed: Each driver was asked to maintain an average speed of 30 miles per hour through the four-mile course. The mean speed for each driver was recorded.
Response time: At a random time, a green light over the front windshield flashed and the driver was asked to respond by pressing a button on the steering wheel. The response time was recorded by an instrument in the vehicle.
Response times (in seconds) for the participants in each texting state are summarized by the three boxplots below.

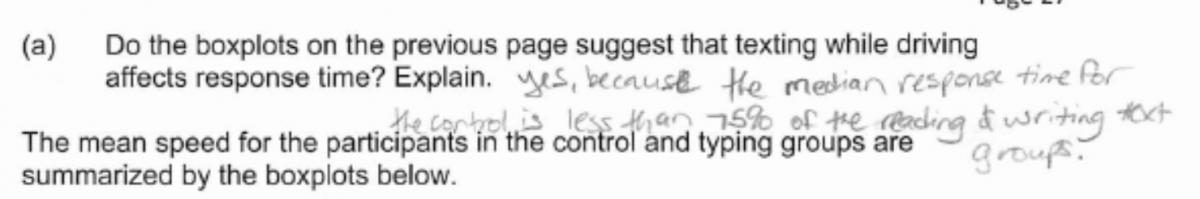
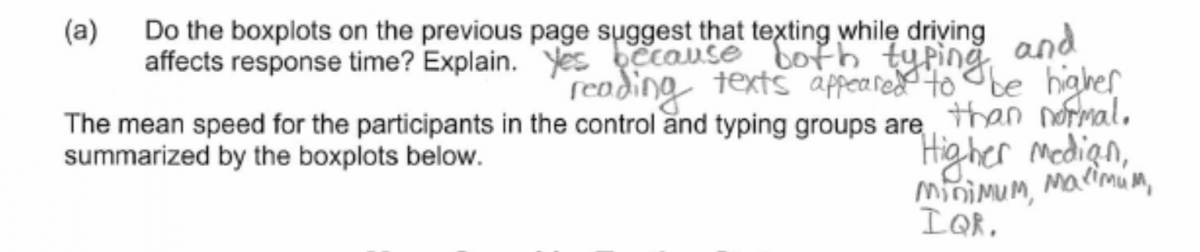
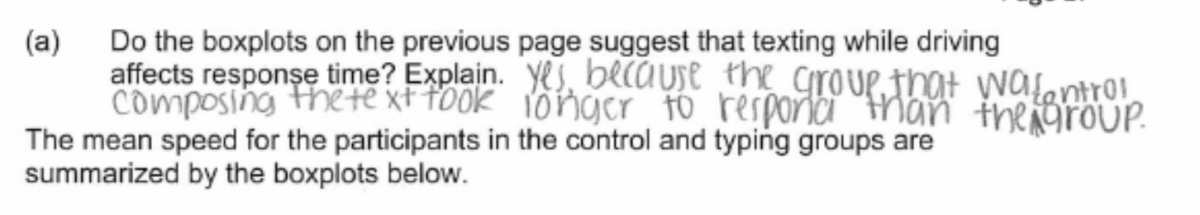
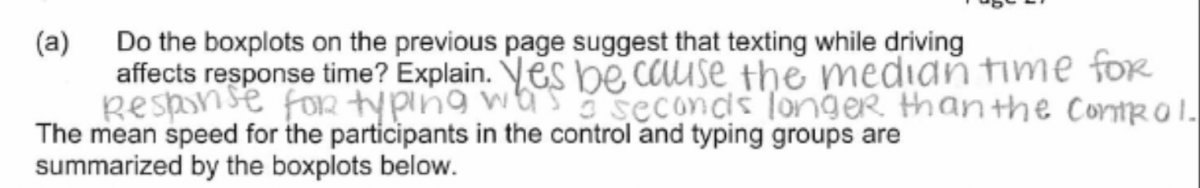
(a) Do the boxplots on the previous page suggest that texting while driving affects response time? Explain.
The mean speed for the participants in the control and typing groups are summarized by the boxplots below.
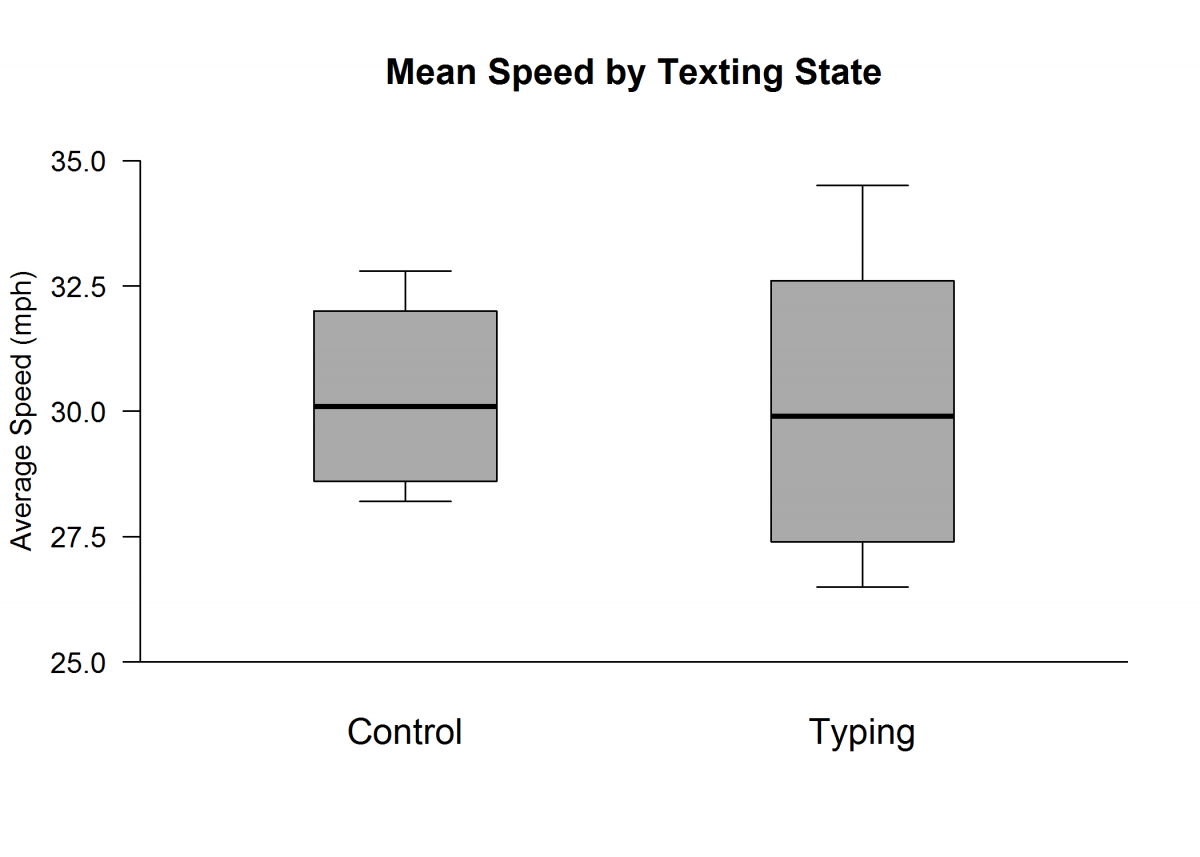
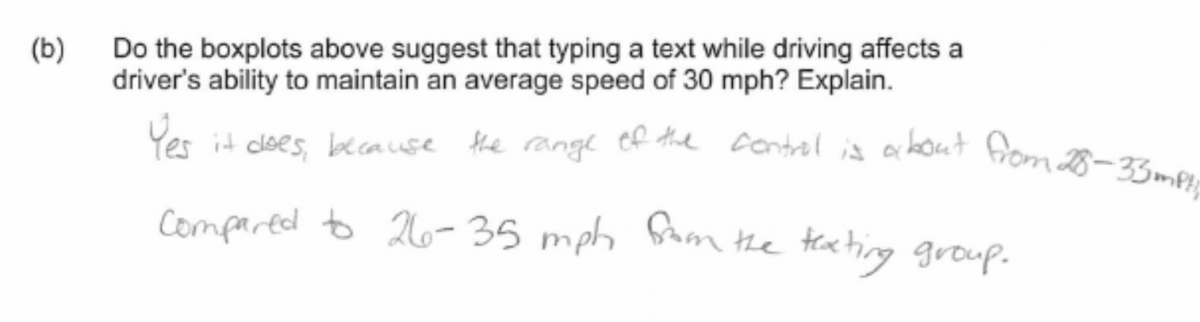
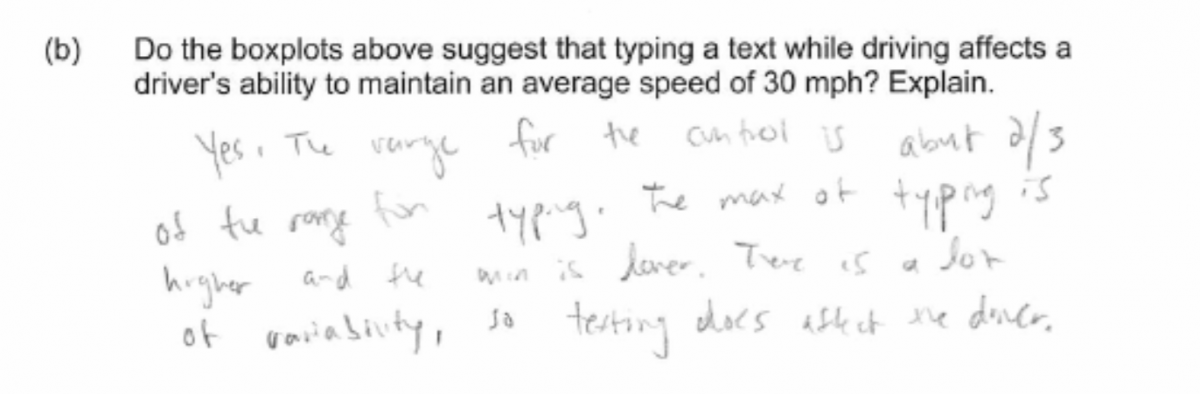
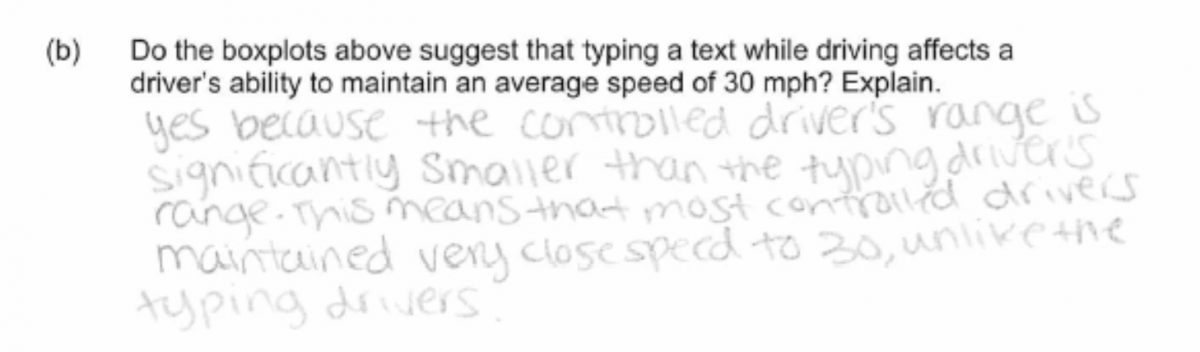
(b) Do the boxplots above suggest that typing a text while driving affects a driver’s ability to maintain an average speed of 30 mph? Explain.
Overview of the question
This question is designed to assess the student’s ability to:
1. Use boxplots to draw a conclusion about possible group differences and provide an informal justification to support the conclusion (parts (a) and (b)).
Standards
7.SP.4: Use measures of center and measures of variability for numerical data from random samples to draw informal comparative inferences about two populations.
S-ID.3: Interpret differences in shape, center, and spread in the context of the data sets, accounting for possible effects of extreme data points (outliers).
Ideal response and scoring
Part (a):
Part (a) asks students to use given boxplots to compare a control group to a typing group and a reading group to reach a conclusion about whether texting while driving affects response time and to justify the conclusion. An ideal response to part (a) is one that recognizes the need to compare the control group to both of the other two groups because texting while driving involves both typing and reading. To be considered essentially correct, the response should indicate that texting does affect reaction time and the justification provided should address the fact that the control group differs from the other two groups both in terms of center and spread, making specific reference to aspects of the box plots.
Responses that indicate that texting does affect response time but which provide a justification that is weak or that does not make specific reference to aspects of the given boxplots are considered to be partially correct. Responses that do not include an explanation or justification are scored as incorrect even if the response includes a conclusion stating that texting does affect response time.
Part (b):
Part (b) asks students to use boxplots to reach an informal conclusion regarding whether typing affects a driver’s ability to maintain an average speed of 30 mph and to justify the conclusion. An ideal response to part (b) is one that concludes that typing does have an effect and notes that there is a difference in variability for the two groups. To be considered essentially correct, the response must also include an appropriate justification that is based on the boxplots provided.
Responses with weak or incomplete explanations or that do not make specific reference to aspects of the given boxplots are considered partially correct. Responses that do not include an explanation or justification are scored as incorrect even if the response includes a conclusion stating that typing does affect a driver’s ability to maintain a speed of 30 mph.
Sample responses indicating solid understanding
Part (a) asks students to use given boxplots to compare a control group to a typing group and a reading group to reach a conclusion about whether texting while driving affects response time and to justify the conclusion. The two student responses below each received a score of essentially correct for part (a). In the first response, the student indicates that texting does affect response time and supports that conclusion by noting that the median of the control group data is less than the lower quartiles of the reading and the typing distributions. The response also refers to specific aspects of the boxplots (median, quartiles) and compares the control to both of the other groups. The second response also indicates that texting does affect response time and references both the typing and reading groups. The conclusion is supported by noting that the median, minimum, maximum and IQR of both the typing group and the reading group are greater than the corresponding values for the control group.
Part (b) asks students to use boxplots to reach an informal conclusion regarding whether typing affects a driver’s ability to maintain an average speed of 30 mph and to justify the conclusion. The three student responses below each received a score of essentially correct for part (b). These responses indicate that typing does affect a driver’s ability to maintain a speed of 30 mph and note that the variability of mean speed is smaller for the control group than for the typing group. The conclusions are supported by pointing out that the range (a specific aspect of the boxplot) is greater for the typing group.
Common misunderstandings
Part (a): Use boxplots to draw a conclusion about possible group differences and provide an informal justification to support the conclusion.
The most common error on part (a) was failure to recognize that there was a need to compare the control group to both of the other two groups—the typing group and the reading group. Many students compared only to one other group or were unclear what group was being used to make the comparison. For example, the two student responses below only addressed the typing group in the comparison with the control group.
In the response below, it is not clear whether the comparison being made is to the typing group or the reading group.
Another common error was to make it clear that the conclusion was based on the given boxplots. To be considered essentially correct for part (a), there needed to be a specific reference to some aspect of the boxplot. The explanation in the student response below was considered to be weak and incomplete because of a lack of connection to the given boxplots and was scored as partially correct.
The following two student responses also provide examples of explanations that were considered to be weak or incomplete.

A surprising number of students provided explanations that were based on personal opinion and that were not linked to the given boxplots. This error is illustrated by the following three student responses.

Part (b): Use boxplots to draw a conclusion about possible group differences and provide an informal justification to support the conclusion.
Some of the common errors on part (a) also occurred on part (b). A number of students provided weak or incomplete explanations and many did not provide a specific connection to the given boxplots as a part of their explanation. This is illustrated by the following two student responses. Both of these responses mention the smaller variability in the control group, but do not connect this observation to the boxplots. These responses were considered to be partially correct for part (b).
As in part (a), it was also not unusual for students to base the explanation in part (b) on personal opinion rather than on information provided by the boxplots, as illustrated by the following two student responses. These responses were both scored as incorrect for part (b).
While most students provided a correct conclusion in part (a), many students failed to articulate a correct conclusion or provided an incorrect explanation in part (b). For example, although a correct conclusion is stated in the following two student responses, the explanation provided in each case is incorrect. In the first response, the student states that “the group typing went above and also below the average speed.” This statement is also true of the control group, and is not a correct justification of the conclusion that typing had an effect. In the second response, the justification is based on a comparison of center, but the centers of both groups are approximately equal.
The following four student responses are typical of those that reached an incorrect conclusion in part (b). Students making this error generally compared the two groups based only on center and concluded that there was no difference between the control group and the typing group because the medians were similar. These student responses were scored as incorrect for part (b).
One final misconception is interpreting observed differences in the boxplots as evidence of proof. While this error was not very common, it does represent a serious misconception in terms of the types of conclusions that can be drawn from data. For example, in the following student response, the first part of the response correctly notes that the centers of the two groups are similar but that they differ in variability. But the student then goes on to say that “this proves that typing does affect average speed.” Based on just a visual comparison of boxplots, this is not a reasonable conclusion.
Resources
Resources
More information about the content assessed in this question can be found in the following resources.
Free Resources
Lessons
Statistics Education on the Web (STEW) has peer reviewed lessons plans. Two lessons related to the topic of this question are:
Classroom and Assessment Tasks
Illustrative Mathematics has peer reviewed tasks that are indexed by Common Core Standard. Three tasks that focus on comparing two groups based on box plots that could be completed by students or used as the basis of a classroom discussion are:
Guidelines for Assessment and Instruction in Statistics Education (GAISE)
Published by the American Statistical Association and available online, this document contains a discussion on comparing distributions using boxplots (pages 52 – 54).
Resources from the American Statistical Association
Bridging the Gap Between Common Core State Standards and Teaching Statistics is a collection of investigations suitable for classroom use. This book contains a section on comparing distributions (Section 4) that contains four Investigations. Two of these investigations (Investigation 4.1: How Far Can You Jump and Investigation 4.2: How Fast Can You Sort Cards) involve comparing distributions based on boxplots and have parts that are similar to the content assessed in this Locus question.
Making Sense of Statistical Studies is a collection of investigations suitable for classroom use. Investigation 11 titled “Distracted Learning” has students collect data from an experiment and then make comparisons similar to those students are asked to make in this Locus question.
Resources from the National Council of Teachers of Mathematics
The NCTM publication Developing Essential Understanding of Statistics in Grades 6 – 8 includes a section on comparing distributions on pages 42 – 50. It includes a discussion of an example similar to this question in which two brands of antacid are compared based on two boxplots.